Buying is so easy. When you pull that trigger to buy, optimism abounds. Maybe it was a recommendation from a friend. Perhaps there was water cooler talk of the next Apple (AAPL). You might even have uncovered it from a time-tested scan. The reason doesn't really matter. The bottom line is you believe the stock just purchased is going to make you money. It might. It might not. The bigger question is have you thought about when you're going to sell.
Keep in mind that I write this blog article from a short-term trader's perspective. I don't buy and hold. Ever. Heck, I won't even hold through a quarterly earnings report. I want to manage risk. How do you manage risk holding into a spin on the roulette wheel? Oops, I meant earnings report. :-)
To be fair, there are options strategies available to lower the risk of earnings shocks, but I'm assuming the majority of stock traders don't use option strategies. I don't. So to mitigate the risk of earnings, I simply get out of the way and move to cash.
If you're a short-term trader like me, let me give you two reasons that I use to sell in the short-term.
1. PPO negative divergence accompanied by a reversing candlestick
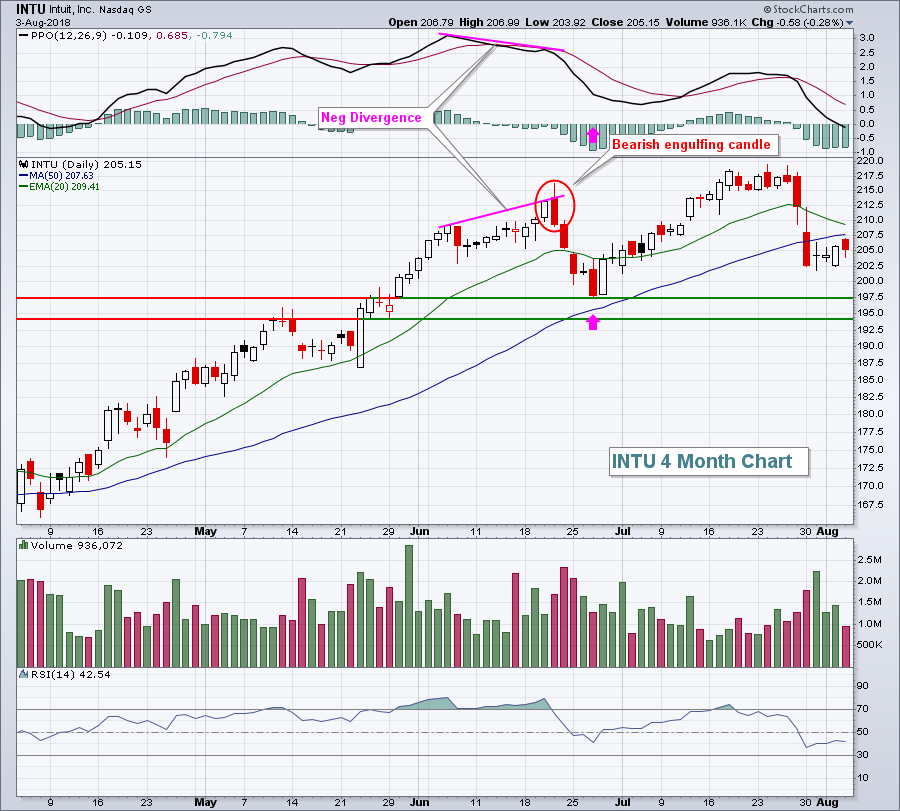
Ok, the theory here is that a negative divergence is a signal of potential slowing momentum. The reversing candlestick confirms it. Intuit (INTU) was a great recent example:
 I am not suggesting that INTU isn't a great long-term investment and that it's topping. What I am saying is that, as a short-term trader, I'm happiest if I can capture short-term profits at short-term peaks. At that point, it frees up cash to pursue other trading opportunities while I've eliminated the "risk" of a pullback in INTU. In the above example, I don't suffer through the next four days of selling. For me, the worst trade is one where I fail to capture profits, then ride a stock back down. It ties up capital, not to mention loses the money I once had earned.
2. False breakout, especially on slowing volume
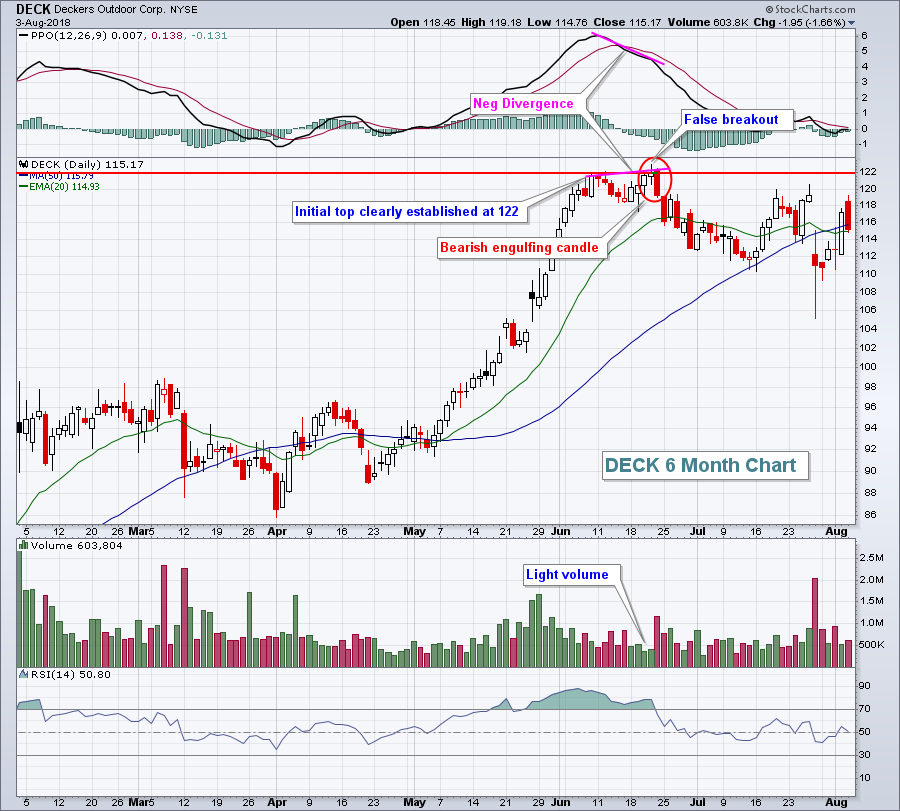
I like to buy at the bottom of an established trading range of an uptrending stock and sell at the top of that range. Yes, it might go through price resistance as an uptrend results in price resistance eventually being cleared. The key word here is eventually. I don't like holding as my trade moves up and down like a roller coaster ride at an amusement park. If I get the opportunity to take my profits, I do it. But if you do hold a bit longer and appear to be getting that breakout that you're looking for, be careful if it turns out to be nothing more than a mirage. When a stock breaks through price resistance, it should generate buying volume and the breakout should stick into the close. I have literally seen thousands of charts where these "false breakouts" occur and the stock pivots and reverses back to the downside. Obviously, it's not a guarantee of a move lower, but I want the odds on my side and usually you'll see an extended reversal. What do these false breakouts look like? Well, here's just one example:
 In addition to the false breakout on light volume, DECK gave us a bonus sell signal in the form of a negative divergence accompanied by a bearish engulfing candle. While there was no guarantee of a pullback, the odds were certainly increasing that we were going to get one.
In my ChartCon 2018 presentation slated for Saturday, August 11th, I will share several trading strategies that help manage risk as a short-term trader and hopefully teach you how to better capture profits. I will be joined by many of my technical analysis colleagues from around the globe, with credentials unmatched in our industry, to provide attendees our thoughts about the stock and bond markets and share our collective wisdom from years of experience, learning, teaching, trading and investing. I have attended countless webinars and conferences over my lifetime and I can assure you they are NOTHING like ChartCon. ChartCon is both educational and inspirational. Not only would I recommend that each and every one of you attend, I would also suggest that you pass ChartCon along to your children and grandchildren. I have been a part of every ChartCon and the information shared will change the financial future for our younger generation. If they're not already investing in their futures, they should begin to do so and ChartCon would be a great start!
You can register for ChartCon 2018 by CLICKING HERE. Enjoy the conference and send me feedback throughout with the ChartCon 2018 Mobile App. I'd love to hear from you!
Happy trading!
Tom
