 The first rule of trading is to stay on the right side of the broad market trend. There are different indexes and indicators we can use to determine the broad market trend, but few are as efficient as the S&P 500 and its 12-month EMA.
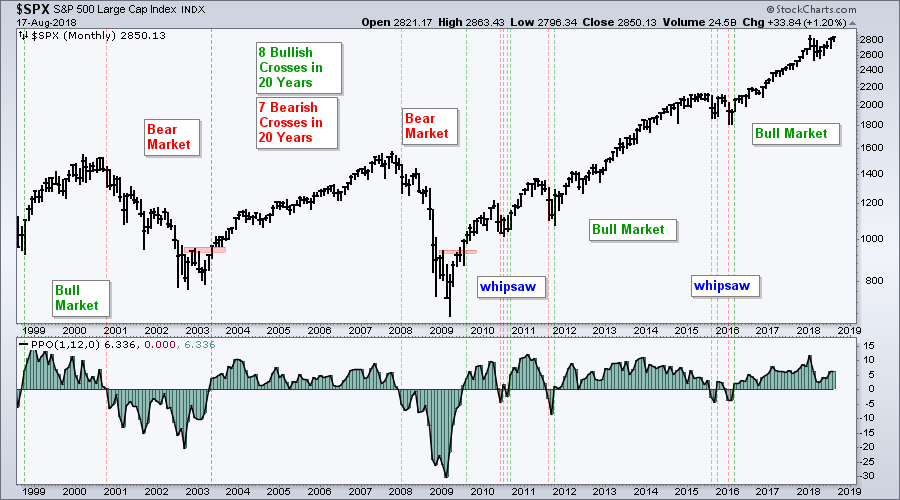
The chart below shows monthly bars for the S&P 500 with the Percentage Price Oscillator (1,12,0), which measures the difference between the 1-month EMA and the 12-month EMA. Note that the 1-month EMA is essentially the monthly close. The long-term trend is up when the PPO is positive and down when the PPO is negative. Showing the PPO as a histogram makes it easy to identify crosses of the zero line. Chartist can do this by setting the last parameter to 0 (1,12,0).
As the chart shows, there were eight bullish crosses in the last 20 years, and seven bearish crosses. This crossover caught a few good bull runs, avoided the bulk of two bear markets and survived a few whipsaws, which are unavoidable.
The S&P 500 turned bullish in March 2016 and remains in bull mode. Notice that this indicator did not trigger bearish in January or February this year. The PPO turned up over the last few months and remains well above the zero line.
Bottom line: It is still a bull market. Trade accordingly!
Plan Your Trade and Trade Your Plan.
- Arthur Hill, CMT
Senior Technical Analyst, StockCharts.com
Book: Define the Trend and Trade the Trend
Twitter: Follow @ArthurHill

