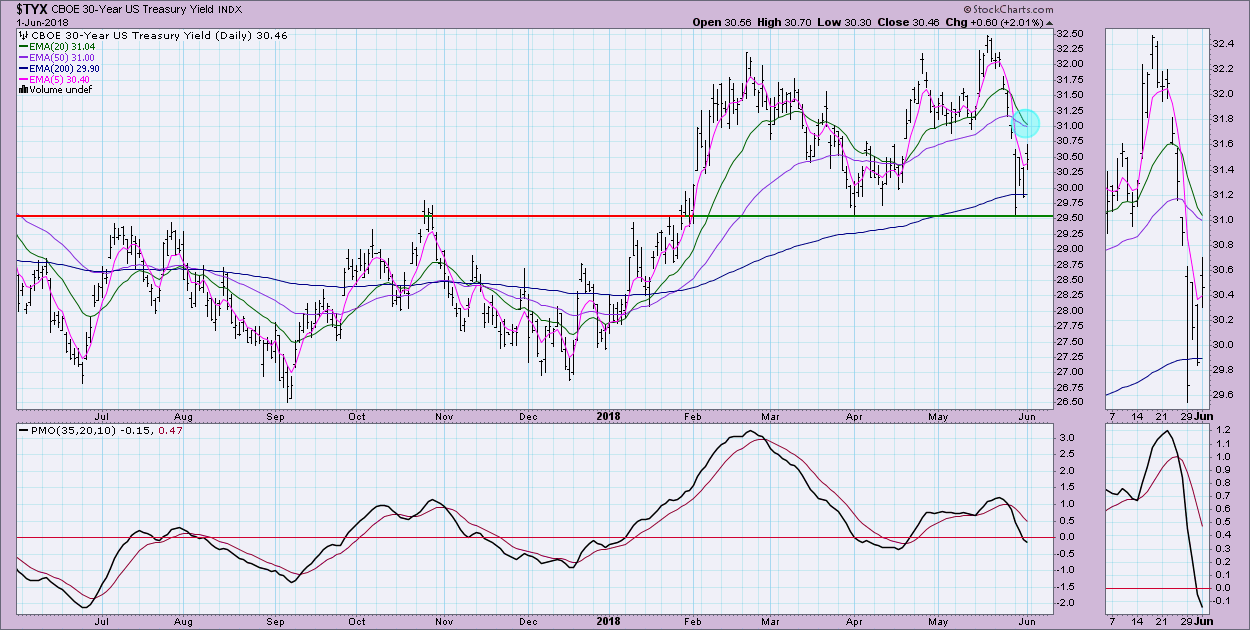
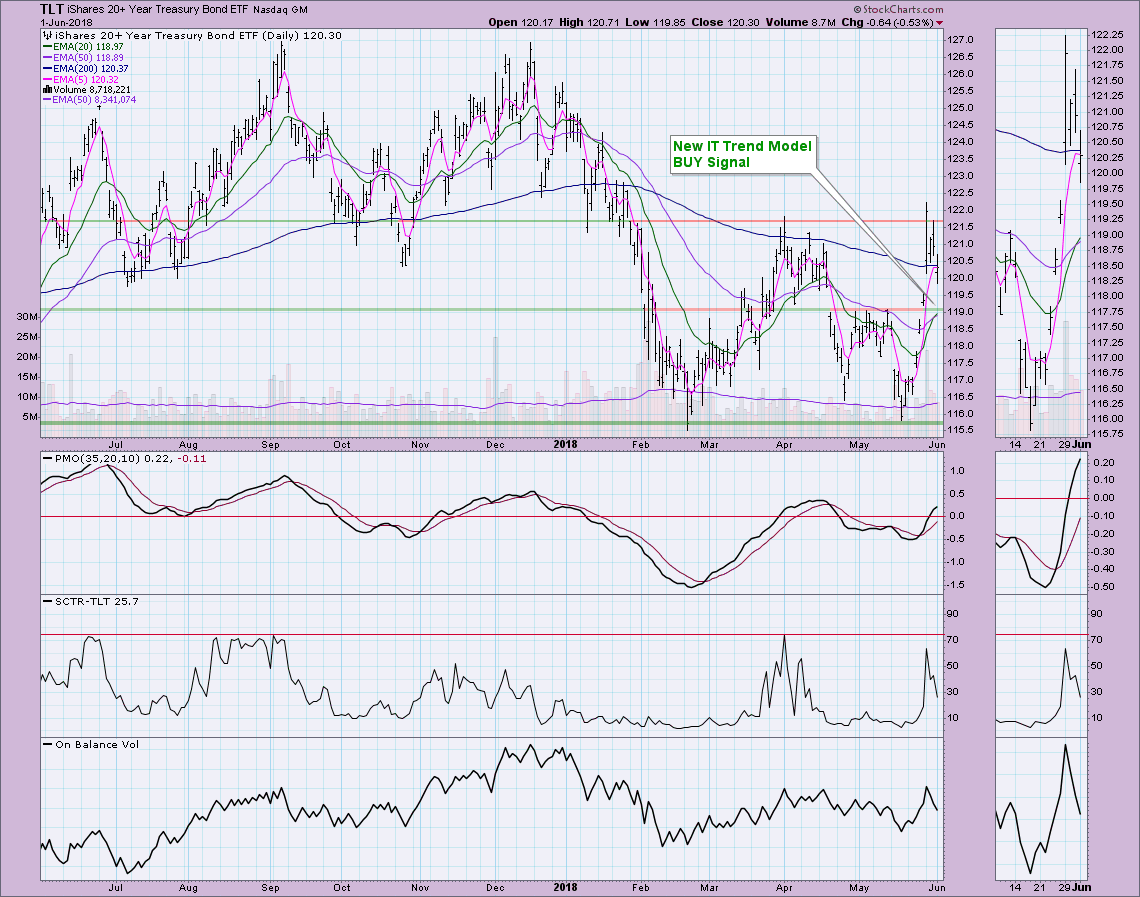
Bonds enjoyed quite a rally over the past two weeks which isn't a surprise given Bond Yields took a nose-dive. The daily chart of the $TYX shows how yields crashed. However, they are now bouncing off strong support at 2.95%. They may not be able to avoid the IT Trend Model Neutral signal that is setting up, but like the new IT Trend Model BUY signal on TLT-- it's arriving too late. The PMO is decelerating on this latest bounce and will likely turn up soon.
The IT Trend Model BUY signal was triggered when the 20-EMA crossed above the 50-EMA. Note the positive crossover in April whipsawed back as the signal arrived at the end of the rally. I suspect we will see the same thing with this signal. TLT hit overhead resistance and was immediately turned away. The PMO is rising, but I can already see the curve of deceleration and the SCTR is losing ground very quickly.
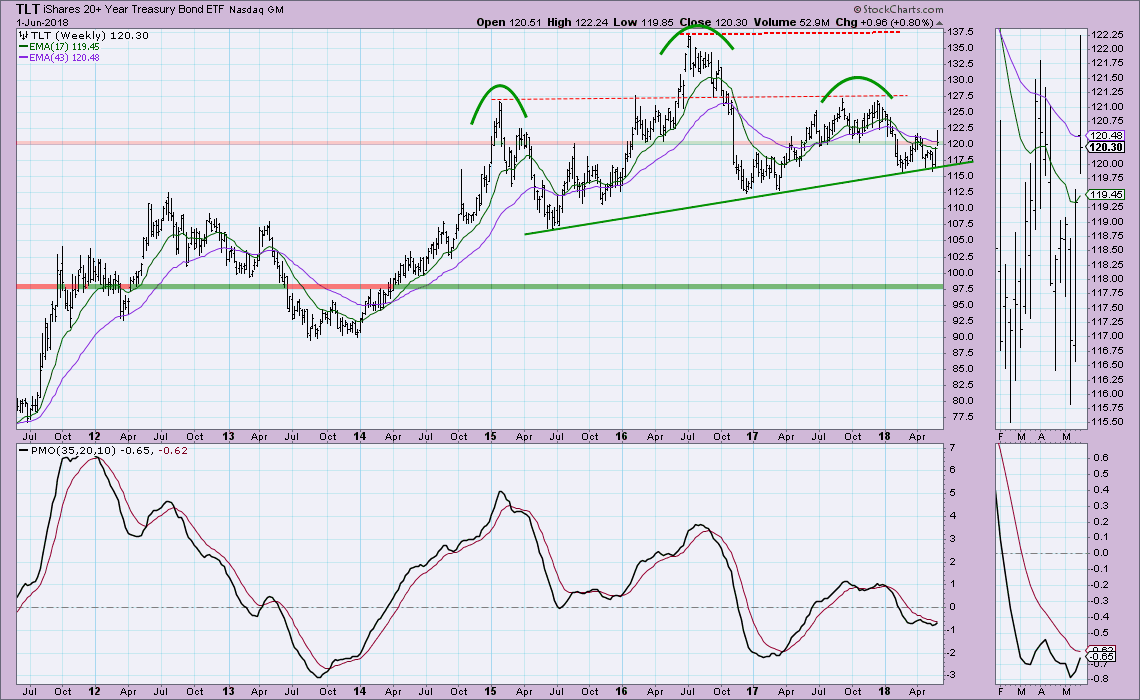
The weekly chart is encouraging. The PMO is attempting to have a positive crossover and the head and shoulders pattern hasn't executed. In fact, price bounced off the rising neckline and formed a shorter-term double-bottom. Take a closer look at this week's OHLC bar in the thumbnail. While price did move above the April high during the week, it dropped down to the bottom of the bar and closed below last week's open.
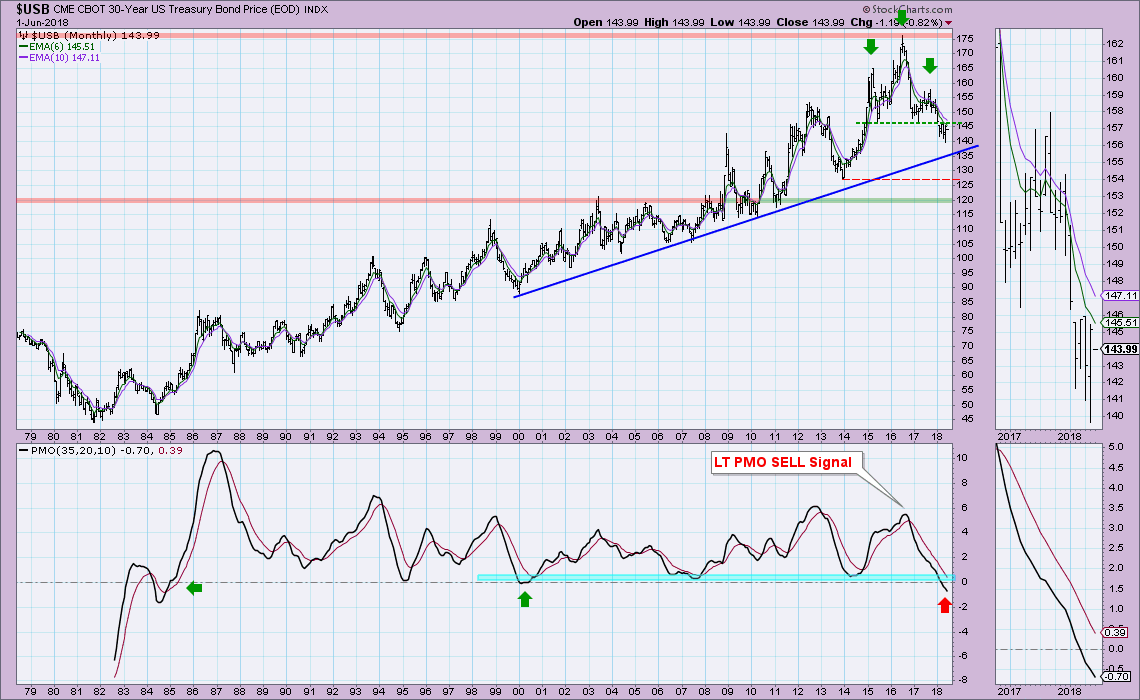
 The long-term chart is where I have the most heartburn. We have a large head and shoulders pattern that has executed. The minimum downside target would be around $120 which lines up perfectly with the 2003 and 2005 tops. Worse, is a PMO that is now reading below zero. That is a condition we have not seen since late 1999/early 2000 where it just barely went negative. The current reading is lowest we've seen since 1984!
 The Fed has been clear about raising rates and that will put a damper on any rallies in Bonds. While there are bullish characteristics on the charts, the long-term picture is bleak. This new ITTM Buy signal on Bonds will likely whipsaw back given the bearish set-up of the 50-EMA located far below the 200-EMA. When a chart shows a bearish EMA configuration, you shouldn't expect bullish chart patterns to execute (i.e. possible double-bottom). They can and do, but typically you'll leave disappointed.
Technical Analysis is a windsock, not a crystal ball.
Happy Charting!
- Erin
Helpful DecisionPoint Links:
DecisionPoint Shared ChartList and DecisionPoint Chart Gallery
Price Momentum Oscillator (PMO)
Swenlin Trading Oscillators (STO-B and STO-V)
**Don't miss DecisionPoint Commentary! Add your email below to be notified of new updates"**


