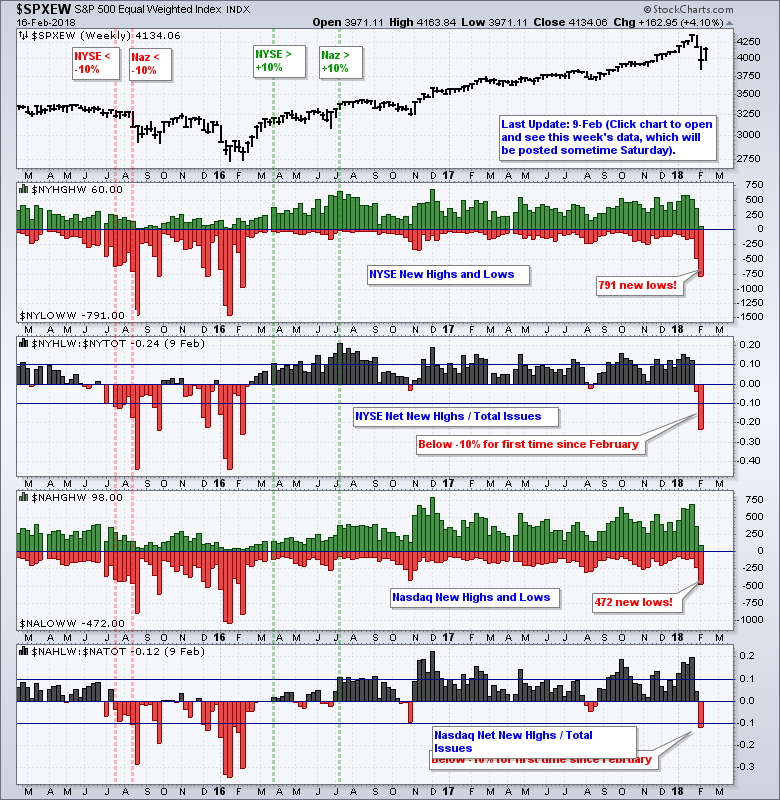
 Stocks rebounded this week as the S&P 500 Equal-Weight Index ($SPXEW) recovered most of the losses from the previous week. On a closing basis, the index fell around 10% in nine days and then recovered around half of this loss with a 5.4% gain the last six days What a ride!
Despite the strong recovery, the 10% decline did some technical damage and I was surprised by the surge in new lows on the NYSE and Nasdaq from February 5th to 9th. In fact, the surge in new lows was the largest since February 2016 and previous occurrences suggest that the market may need more time to find its bullish footing.
The chart below shows the number of NYSE and Nasdaq issues that recorded a 52-week high or low at some point during the week. Barron's readers may be familiar with this weekly indicator because it has been featured in their Market Lab for eons. Most of the issues are stocks, but there are also plenty of non-operating names on the list, such as warrants, income funds, bond hybrids, preferreds and such).
Everything traded on the NYSE and Nasdaq is a financial instrument and the explosion of new lows indicates that there are lots of downtrends out there, which cannot be good for the markets. Overall, there were 791 new lows on the NYSE the previous week and 472 new lows on the Nasdaq.
To put this into perspective, Net New Highs as a percent of total issues plunged below -10% on both exchanges. For reference, the red dashed lines show the percentage of Net New Highs moving below -10% in July 2015 (NYSE) and August 2015 (Nasdaq). The market did not recover until these indicators move back above +10% in March 2016 (NYSE) and July 2016 (Nasdaq). Thus, it took some time to recover after the surge in new lows.
Charting Notes: To plot the high-low histogram, I am using "Price - Up/Down Pair" as an indicator and putting new highs and lows in the parameters box ($NYHGHW,$NYLOWW). Net New Highs equals new highs less new lows. The percentage of Net New Highs is shown by dividing by the total issues traded. This can be done in SharpCharts by adding "Price" as an indicator and dividing the symbols in the parameters box ($NAHLW:$NATOT). StockCharts members can click on the image below to open this high-low chart and see the settings.
Plan Your Trade and Trade Your Plan.
- Arthur Hill, CMT
Senior Technical Analyst, StockCharts.com
Book: Define the Trend and Trade the Trend
Twitter: Follow @ArthurHill


