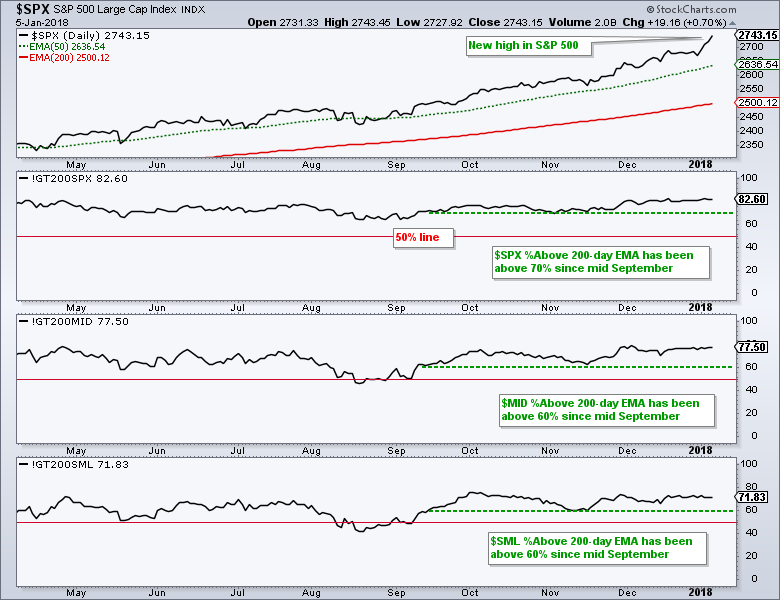
The stock market is never 100% bullish with all stocks participating in an uptrend. There are always some holdouts and pockets of weakness, but the broader market can continue higher as long as the pockets of strength are greater than the pockets of weakness.
The percentage of stocks above the 200-day EMA is a great way to measure internal strength and this indicator has remained strong since mid September. Of note, S&P 500 %Above 200-day EMA (!GT200SPX) has been above 70% since September 12th and large-caps show the most internal strength overall. Mid-Cap %Above 200-day EMA (!GT200MID) has been above 60% since September 12th and above 70% since November 28th. Small-Cap %Above 200-day EMA (!GT200SML) has been above 60% since September 15th and oscillated around the 70% level since late November.
Currently, the percentage of stocks above the 200-day EMA is as follows: S&P 500 (83%), S&P Mid-Cap 400 (78%) and S&P Small-Cap 600 (72%). This implies that 77% of stocks in the S&P 1500 are above their 200-day EMA and 23% are below.
Thus, around a quarter of stocks in the S&P 1500 are in long-term downtrends and not participating in the current bull market. This may seem negative, but it is not. Stocks in long-term uptrends outnumber stocks in long-term downtrends by a 3 to 1 margin and this is more than enough to support a bull market. The trouble starts when these lines start moving below the 50% level. Let's not cross that bridge until it gets here.
Follow me on Twitter @arthurhill - Keep up with my 140 character commentaries.
Thanks for tuning in and have a good day!
--Arthur Hill CMT
Plan your Trade and Trade your Plan

