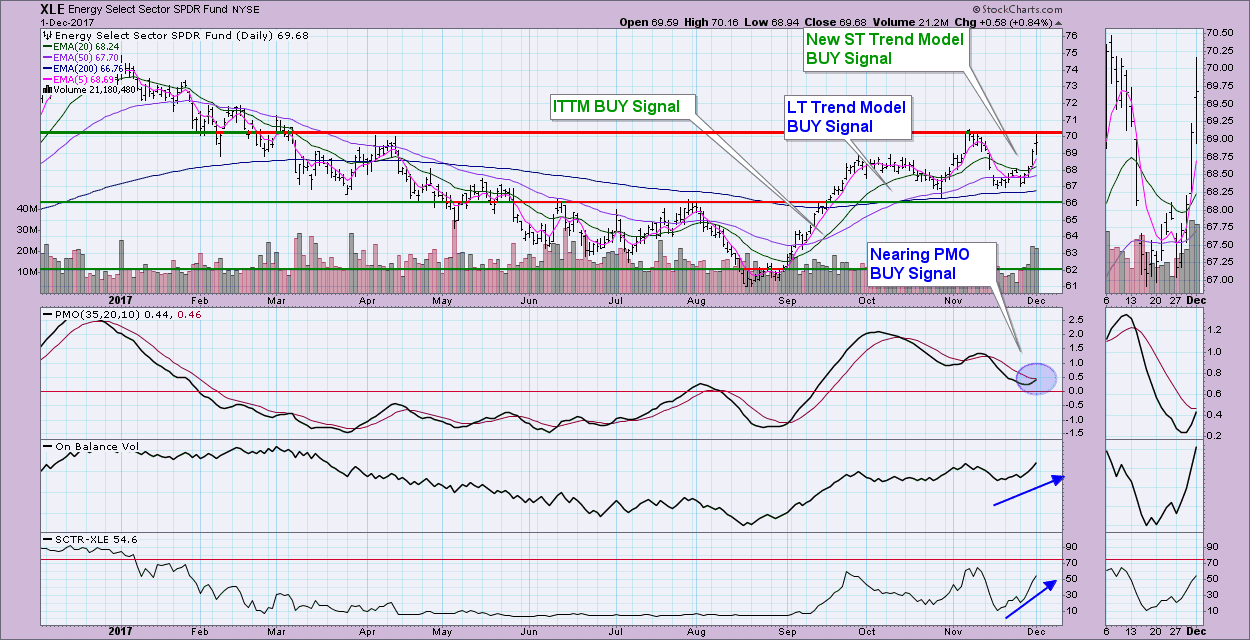
The energy sector has been on a bit of a rollercoaster the three months, moving from deep lows in August to a new trading range of large percentage highs and lows. I'm starting to see signs that the trading range is going to be history as price now is butting up against overhead resistance at the top of the trading range.
On XLE, the Energy SPDR, we had a hint that the rally that started at the beginning of September would continue on. The 20-EMA crossed above the 50-EMA which triggered an IT Trend Model BUY Signal. Back in October an all-important LT Trend Model BUY signal appeared. These are very important because they tell us that Energy is now emerging from its 'bear market' configuration. Today we get to compound the bullish chart with a new ST Trend Model BUY signal that was triggered when the 5-EMA crossed above the 20-EMA. The OBV and SCTR have been confirming the latest rally and now the PMO is about to generate a new BUY signal. Price has hit overhead resistance and could require a pullback before punching through, but ultimately I believe it will penetrate overhead resistance given the extraordinary pile up of bullish BUY signals.
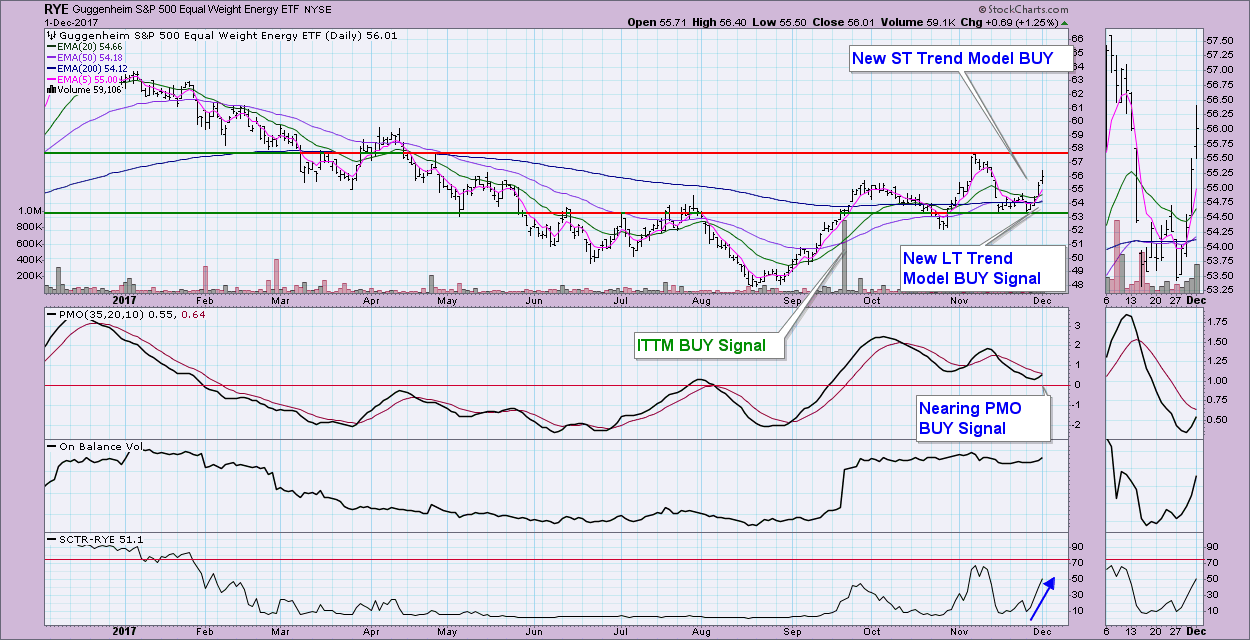
 I'd like to take a look at the equal-weight version of the Energy ETF, RYE. The picture is quite similar, only TODAY we got both the ST and LT Trend Model BUY signals. The PMO is also working its way up to a new BUY signal. The SCTR on both XLE and RYE have shot up to also confirm the likely intermediate-term rally that is on tap. The rising volume on the latest rally is also very encouraging.
 Conclusion: Many have been touting the return of the energy sector for some time, but I think this time we should see it jump start. With so many bullish signals on both charts, a breakout seems inevitable.
Helpful DecisionPoint Links:
DecisionPoint Shared ChartList and DecisionPoint Chart Gallery
Price Momentum Oscillator (PMO)
Swenlin Trading Oscillators (STO-B and STO-V)
Technical Analysis is a windsock, not a crystal ball.
Happy Charting!
- Erin
**Don't miss DecisionPoint Commentary! Add your email below to be notified of new updates"**
