ChartWatchers November 18, 2017 at 01:27 PM
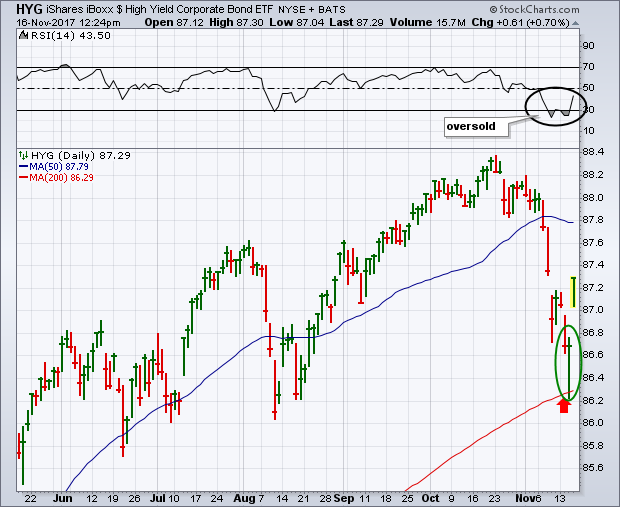
The recent selloff in high yield junk bonds has attracted a lot of attention in the financial media. My Tuesday message showed the iBoxx High Yield Corporate Bond iShares (HYG) headed down for a test of chart support at its August low and its 200-day moving average... Read More
ChartWatchers November 18, 2017 at 01:22 PM
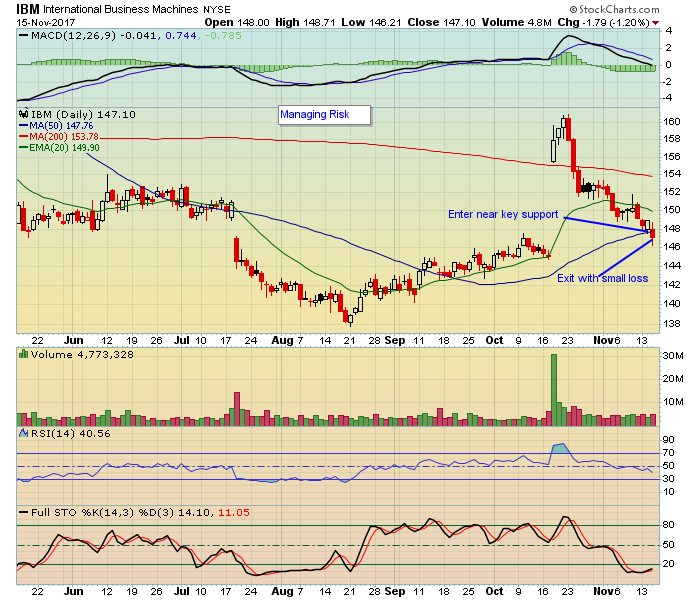
One by-product of focusing on stocks that beat earnings handily is the opportunity to boost overall returns... Read More
ChartWatchers November 18, 2017 at 11:46 AM
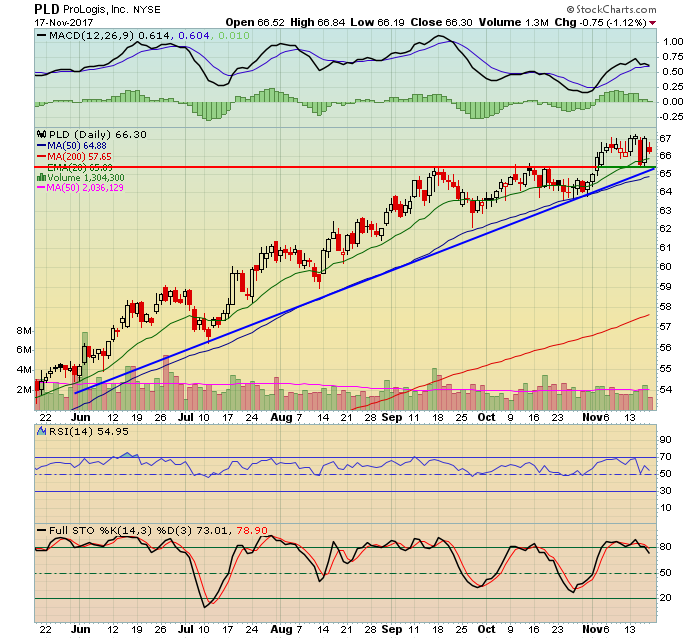
I'm a big historian and a fan of the "history repeats itself" theory. But I'm a bigger fan of technical analysis where price action simply doesn't lie. You can listen to all the CNBC "hype" if you'd like, where their "experts" provide their favorite picks... Read More
ChartWatchers November 18, 2017 at 04:27 AM
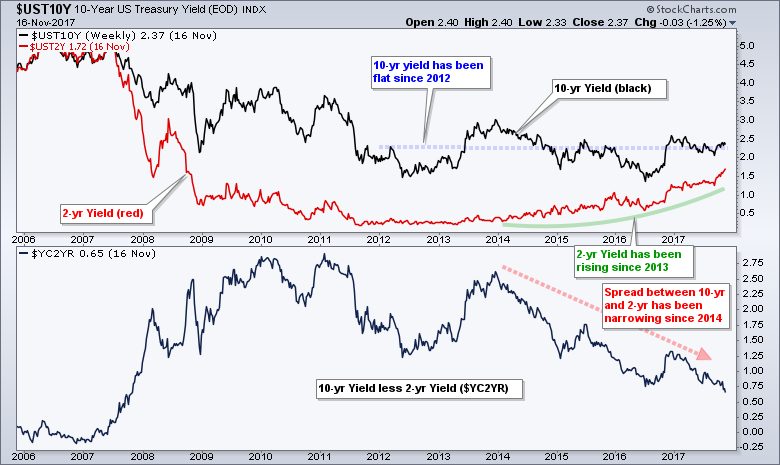
I hear talk that the yield curve is flattening and that this is a problem for the stock market. While it is true that the spread between the 10-yr T-Yield ($UST10Y) and 2-yr T-Yield ($UST2Y) is the lowest since 2007, the yield curve itself is by no means flat... Read More
ChartWatchers November 17, 2017 at 08:00 PM
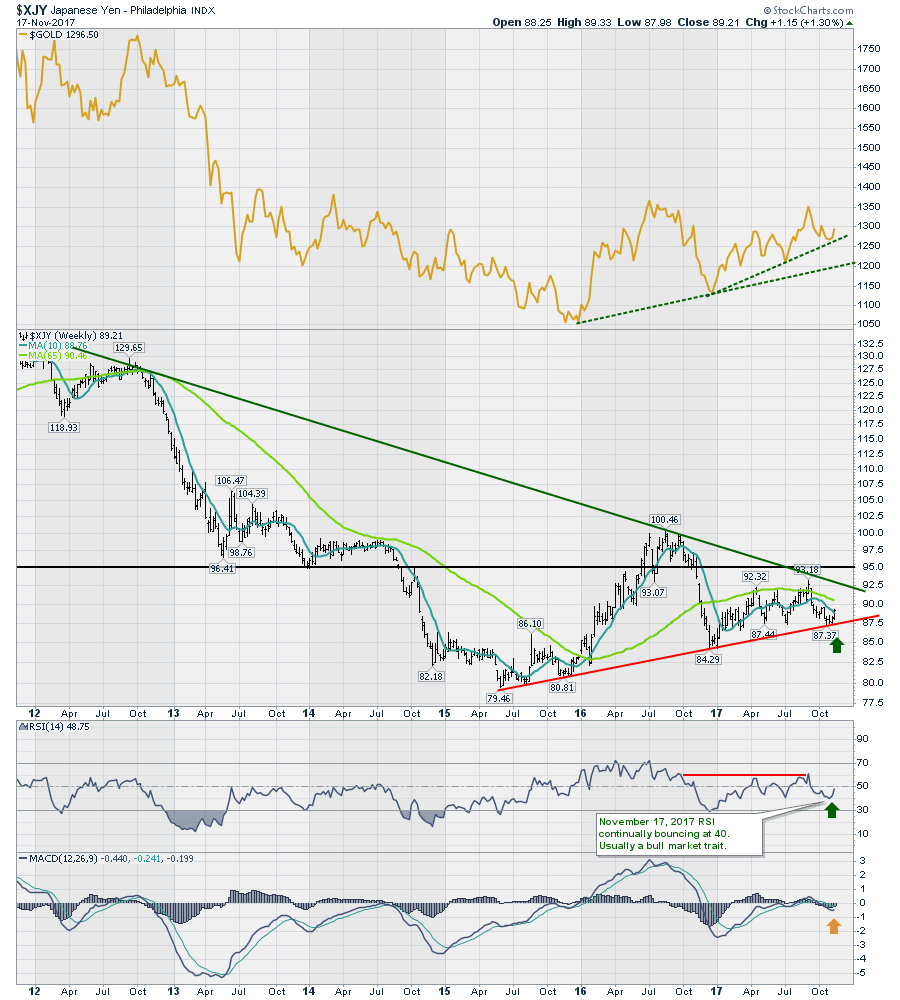
The Yen ($XJY), the Euro ($XEU) and the US Dollar ($USD) are all at important inflection points this week. Stay tuned as this could really decide the direction of Gold, Silver and other commodities this week... Read More
ChartWatchers November 17, 2017 at 05:27 PM
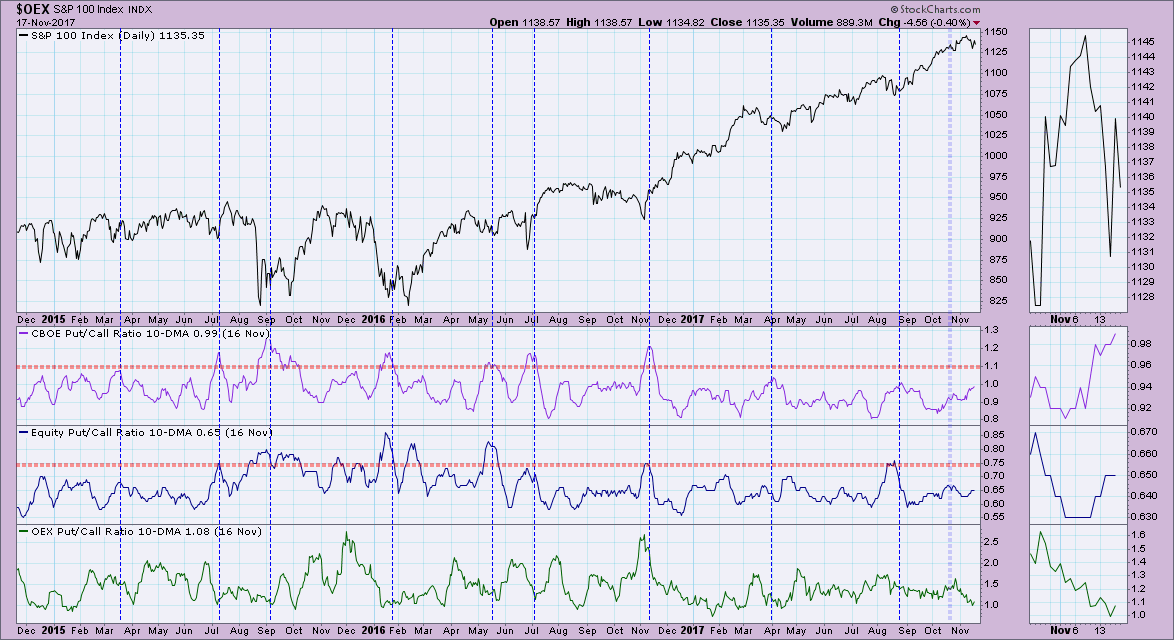
Sentiment charts haven't been all that enlightening with mostly neutral readings. However, we are reaching bearish levels that generally result in a rally. Here's my interpretation of the latest sentiment from the put/call ratios, AAII, NAAIM and Rydex Ratio... Read More
ChartWatchers November 04, 2017 at 11:59 AM

When considering this question, I believe the correlation indicator tells us most of what we need to know. After all, we're pondering which global market movements tend to be reflected in similar movements in the U.S. market. For purposes of the U.S... Read More
ChartWatchers November 04, 2017 at 04:45 AM

An uptrend means prices are advancing and higher highs are the order of the day. We do not know how long a trend will persist, but there is clear evidence that trends persist. Just look at the S&P 500 since early 2016 for a recent example... Read More
ChartWatchers November 03, 2017 at 08:28 PM
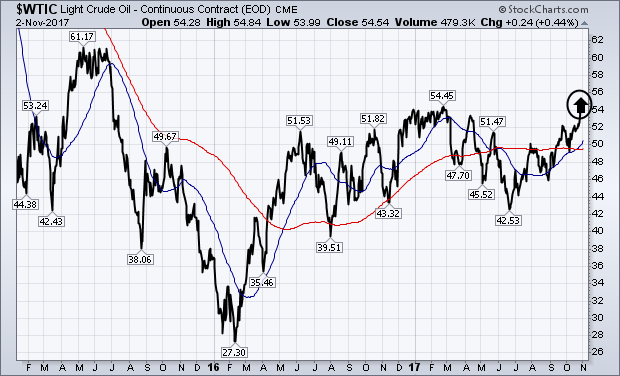
My Wednesday message showed Brent Crude Oil trading over $60 for the first time in more than two years. Brent is trading over $62 today. It also showed West Texas Intermediate Crude Oil (WTIC) trying to break through overhead resistance at $55... Read More
ChartWatchers November 03, 2017 at 05:56 PM
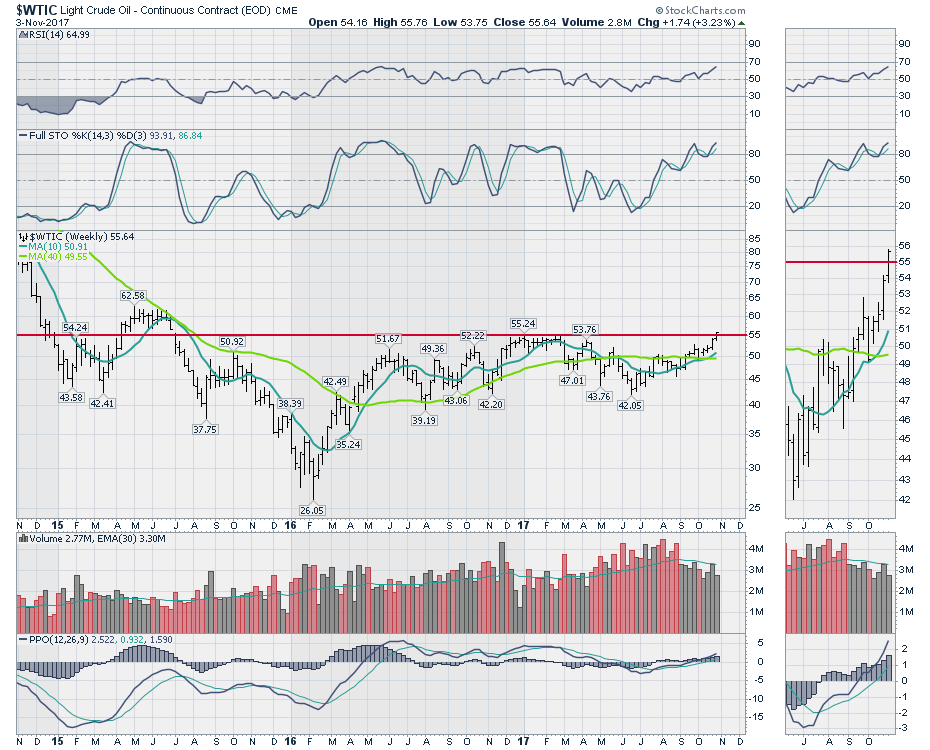
The price of oil closed above all the weekly closing highs for the last two years to kick off November. West Texas climbed on Friday above all the intraday highs and all the daily closes to put an exclamation mark on the breakout... Read More
ChartWatchers November 03, 2017 at 05:40 PM
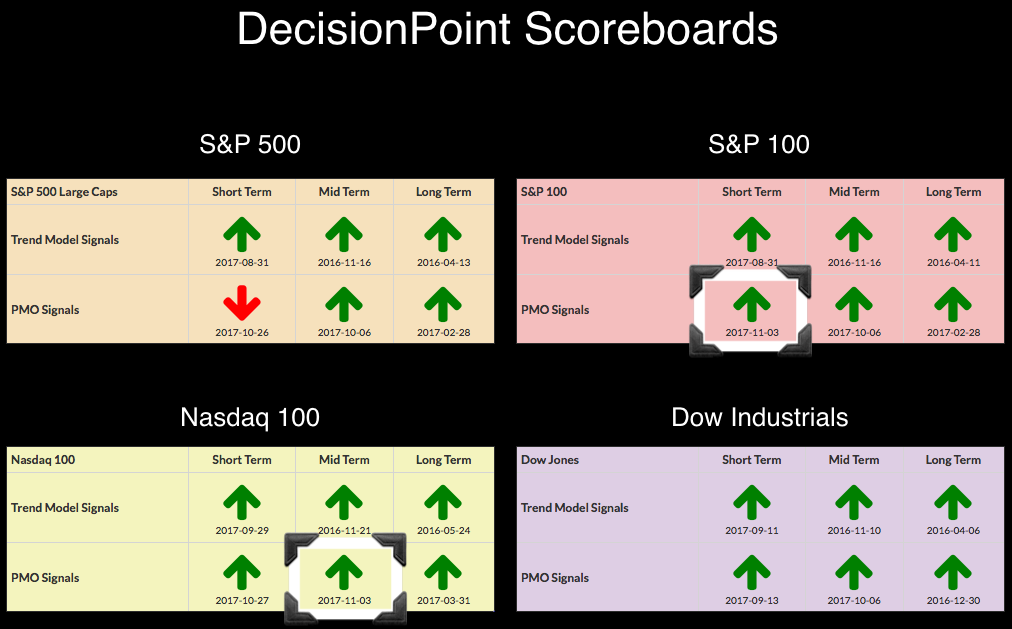
I've been expecting a new PMO BUY signal on both the SPX and the OEX. The OEX managed to wrangle the PMO above its signal line, but the SPX is struggling to garner its PMO BUY signal... Read More
ChartWatchers November 03, 2017 at 01:04 PM
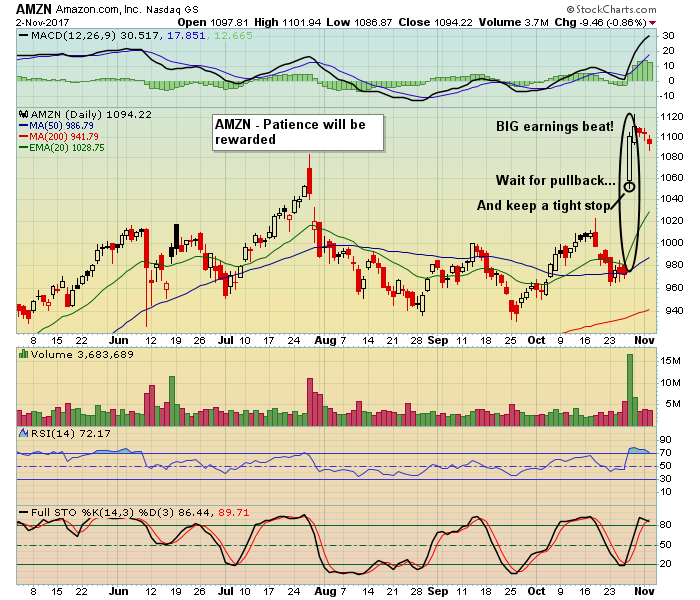
Earnings Season is winding down. So far it's been quite positive. How do I know? Just look at the overall market. We certainly saw strong earnings from the tech giants including Amazon, Apple, Facebook and Google... Read More