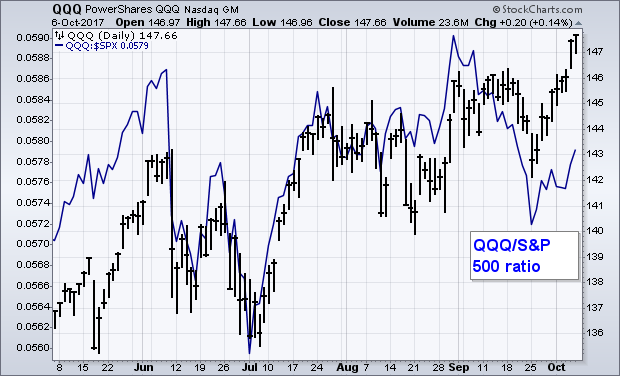
Chart 1 shows the Powershares QQQ ETF hitting a record high this week. It was the last of the major stock indexes to do so, and its breakout is a positive sign for the market. It also did slightly better than the rest of the market. The QQQ, however, has still been a relative laggard over the last month. That's shown by the falling QQQ/SPX ratio since the start of September (blue line). This week's upturn in its RS line may be a sign that some funds are flowing back into large tech stocks. But there's more going on beneath the surface with the QQQ. For one thing, comparing the QQQ to the S&P 500 doesn't fully reflect QQQ recent underperformance. That's because the S&P 500 itself has been an underachiever over the last month (relative to smaller stocks). To get a truer picture we have to compare the QQQ to the groups that have been getting most of the tech money. Financials have been the biggest beneficiary of the past month's rotation out of techs. That's been tied to the upturn in bond yields, and expectations for another rate hike in December. The reasons why financials usually outperform techs when rates are rising have been described in previous messages. Let's compare their recent relative performance.
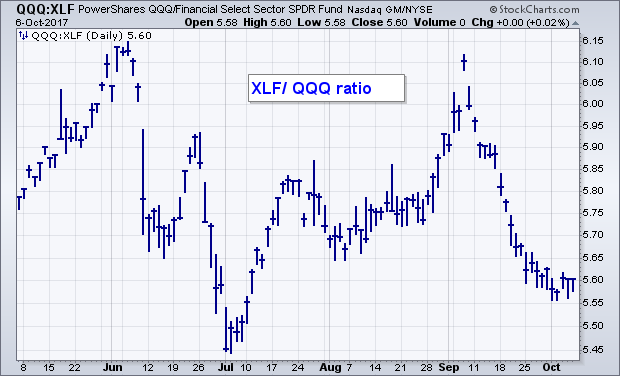
 Anyone still doubting that a significant sector rotation has been going on need only look at the next chart. The blue bars in Chart 2 plot a relative strength ratio of the PowerShares QQQ divided by the Financial Sector SPDR (XLF). The bars show the QQQ underperforming the XLF by a wide margin since the start of June, and again during September. Since the start of June, financials have nearly tripled QQQ performance (14% versus 5%). Since the start of September, financials have outperformed the QQQ by a 7% to 1% margin. Rising bond yields have been the main reason why. And signs of a stronger economy. Three other economically-sensitive sectors outperforming the QQQ over the last month are the industrials (including transports), energy, and materials. That shows that money has also been flowing into parts of the market that do better in a climate of rising rates and a stronger economy. Those three sectors have doubled the performance of the QQQ over the past month. They also hint at rising inflation.

