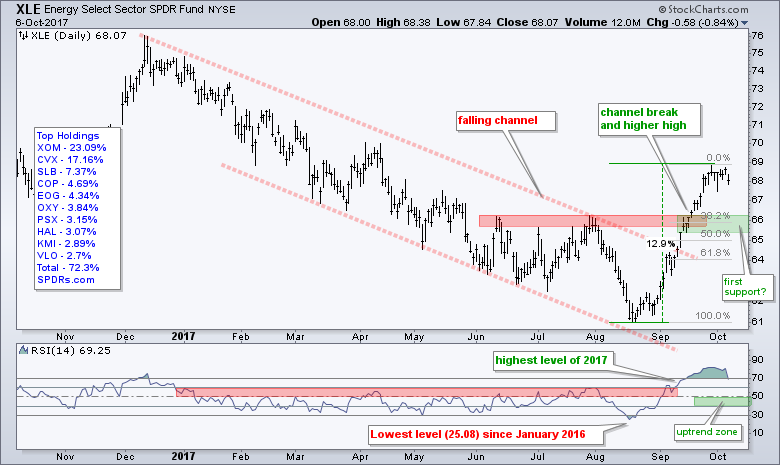
The Energy SPDR (XLE) is the top performing sector SPDR since mid August with a double digit advance over the last seven weeks. On the price chart, XLE broke out of the channel, exceeded its summer highs and pushed RSI above 70 for the first time this year. It was a remarkable move, but the ETF is short-term overbought and ripe for a corrective period, which could involve a pullback or a consolidation.
Where might a pullback find support and reverse? I am watching the summer highs, the Fibonacci Retracements and RSI for answers to this question. A key tenet of technical analysis is that broken resistance turns into the first support level. XLE broke resistance in the 65.5-66 area and this area turns first support to watch on a pullback. Also notice that the 38.2% retracement resides in this area. This is the minimum retracement expected on a correction.
The indicator window shows RSI failing to break above 60 from January to August. It is typical for RSI to fail in this area during downtrends. The opposite holds during an uptrend. If a bigger uptrend is indeed emerging, I would expect RSI to hold the 40 area on any pullback and would look for a pullback to end when RSI enters the 40-50 zone.
Follow me on Twitter @arthurhill - Keep up with my 140 character commentaries.
****************************************
Thanks for tuning in and have a good day!
--Arthur Hill CMT
Plan your Trade and Trade your Plan
*****************************************

