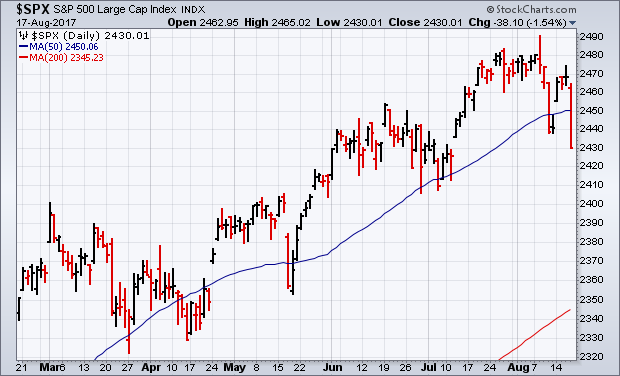
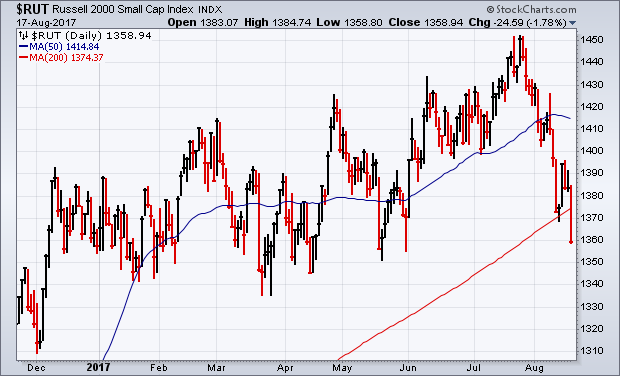
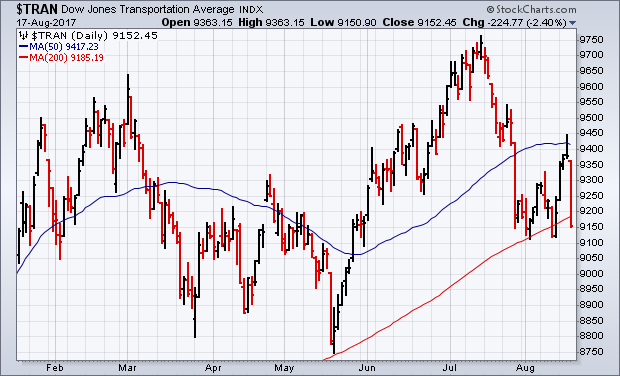
S&P 500 FALLS TO SIX-WEEK LOW... Selling pressure resumed with a vengeance today. And a lot of support levels have been broken. Chart 1 shows the S&P 500 falling back below its 50-day average to the lowest level in more than a month. Volume was higher. More serious damage was done to smaller stocks. Chart 2 shows the Russell 2000 Small Cap Index closing below its 200-day average for the first time in more than a year. Yesterday's message explained why it was important for the RUT to find support around its 200-day average. It's failure to do so is a bad sign for the market. The same is true with transports. Chart 3 shows the Dow Transports plunging more than 2% today and closing just below their 200-day average. Airlines were the biggest losers. My message from yesterday also explained why it was important for that group to hold that support line. That makes today's big selloff even more troubling. All market sectors fell today with the biggest losses in technology, industrials, financials, and cyclicals. Staples and utilities suffered the smallest losses which is normal in a market pullback. The CBOE Volatility (VIX) Index spiked 32% higher, while the Nasdaq 100 Volatility Index (VXN) surged 30%. It looks like August is living up to its reputation as one of year's most dangerous months. And September still lies ahead.


