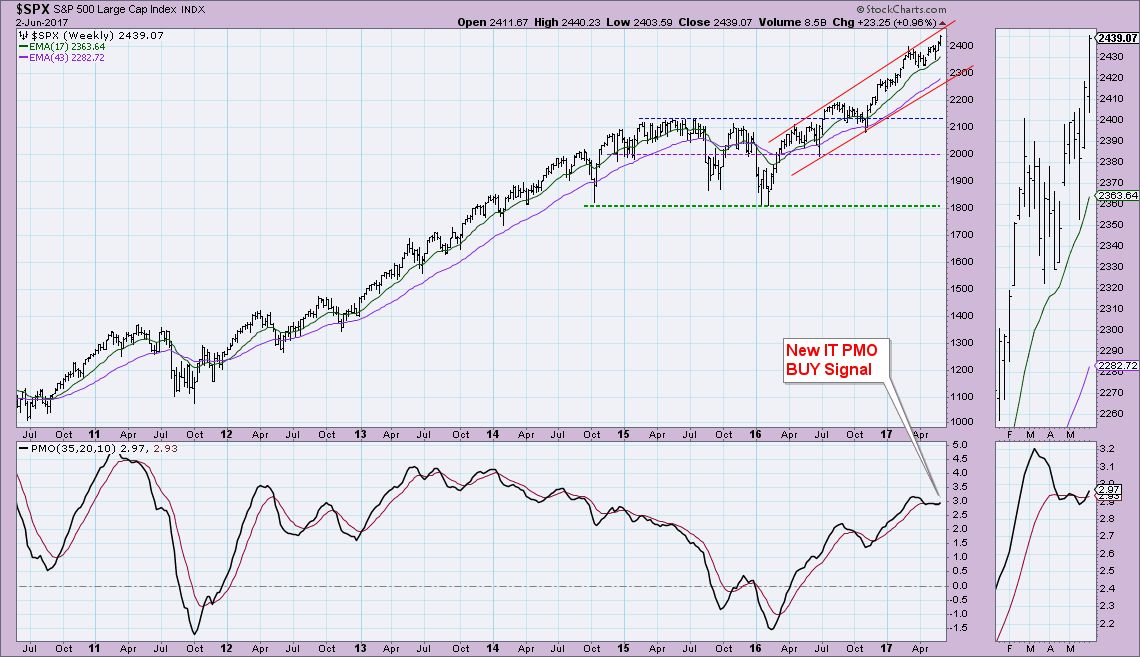
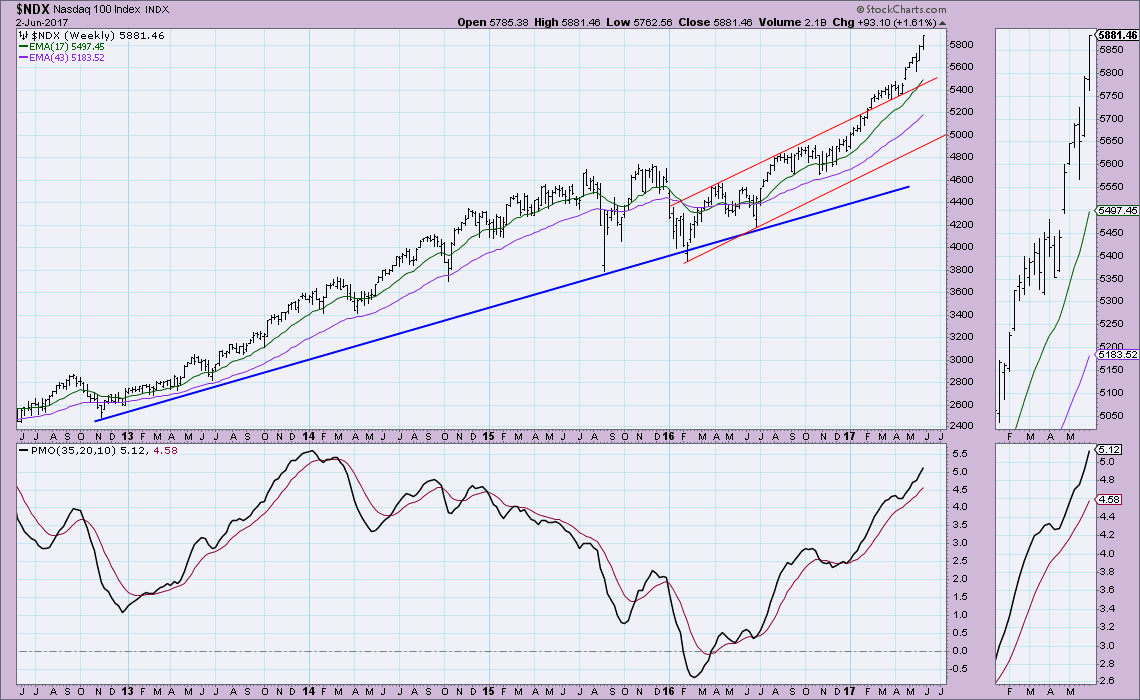
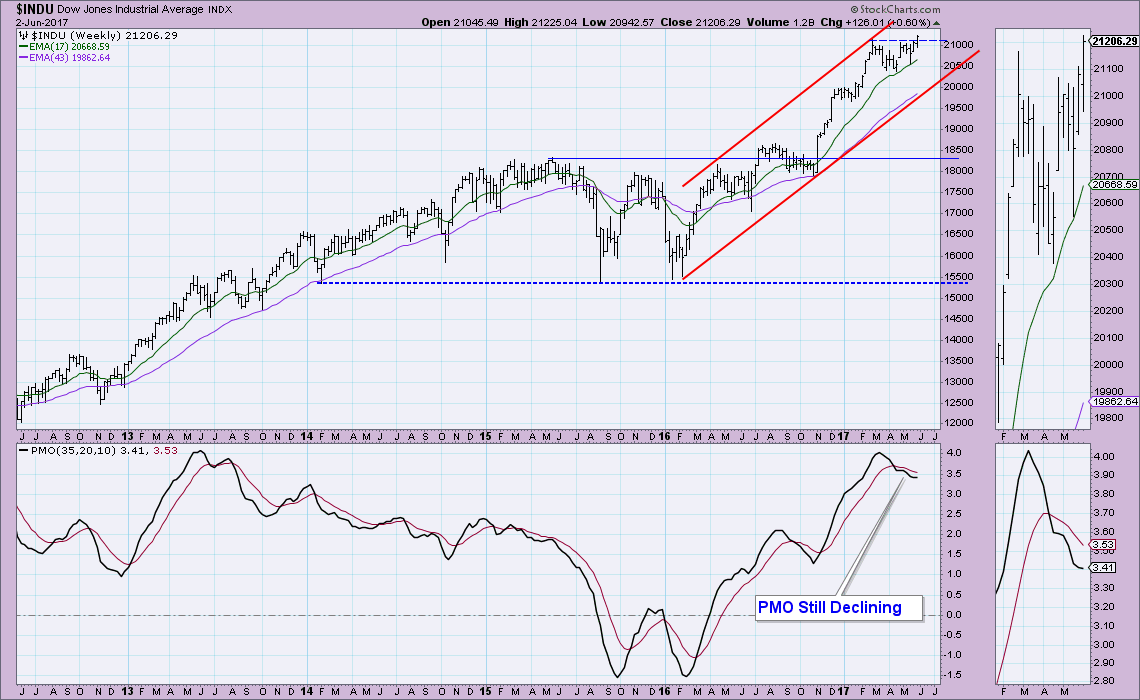
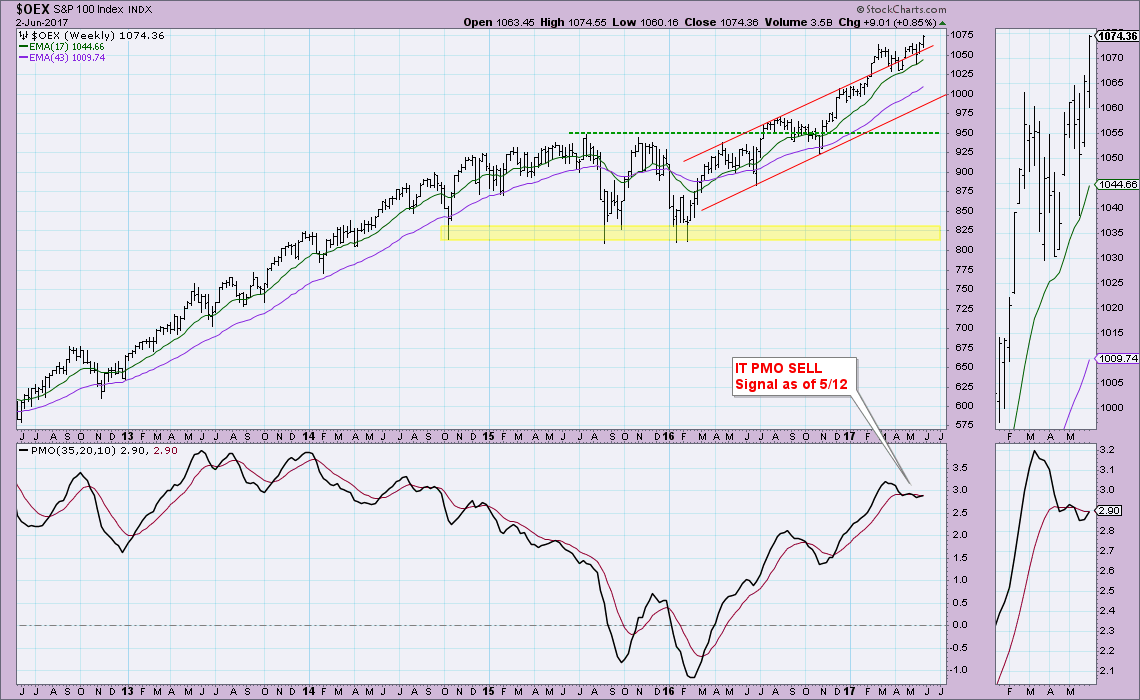
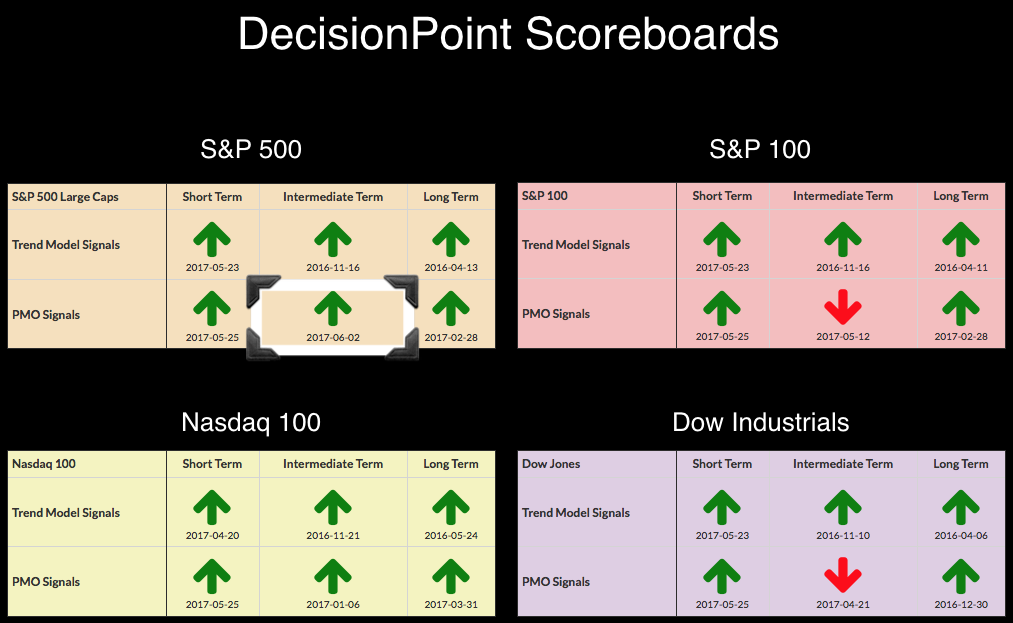
The S&P 500 garnered a new PMO BUY signal on the weekly chart. Now we have two Scoreboards that are completely green. Technology has been a darling for quite some time so it is no surprise to see the oldest BUY signals residing on its Scoreboard. The two SELL signals remaining on the Scoreboards are on the Dow and OEX. The weekly charts for all four Scoreboards are below.
Price has stayed consistently over the 17-week moving average since the election. Price is testing the top of the rising trend channel, but of course could move higher and remain within it. My words of caution: 1) The PMO has flattened and this could be just another whipsaw signal and 2) With a trend channel this 'fat', the rising trend could stay intact even with a deep decline or correction which leaves us somewhat vulnerable.
The Nasdaq 100 has been holding a weekly PMO BUY signal since January and it doesn't look like it will be switching anytime soon. It is getting quite overbought, but again, it is accelerating fairly quickly upward will be hard to turn around which doesn't suggest a decline or correction.
Meanwhile the Dow Industrials is struggling just to turn up. This week's breakout bar is encouraging, the weekly PMO should be moving higher by next week, barring a deep decline.
The S&P 100 nearly joined the S&P 500 today with a crossover BUY signal on the weekly chart. However, as Maxwell Smart with thumb and index finger touching would say, "It missed it by that much!" Expect a BUY signal on its Scoreboard next week. Price traded above support along the top of the previous rising trend channel.
Conclusion: The Scoreboards are fairly clear. Price trends in all three timeframes are bullish and momentum in all three timeframes are nearly all bullish. With a market showing this much internal strength, it is difficult to get overly bearish. At this point, we should expect bullish outcomes before bearish ones.
Helpful DecisionPoint Links:
DecisionPoint Shared ChartList and DecisionPoint Chart Gallery
Price Momentum Oscillator (PMO)
Swenlin Trading Oscillators (STO-B and STO-V)
Technical Analysis is a windsock, not a crystal ball.
Happy Charting!
- Erin
**Don't miss DecisionPoint Commentary! Add your email below to be notified of new updates"**

