At the time of the last ChartWatchers article, I didn't really see a whole lot to be nervous about. However, the bullish picture certainly is getting a bit murkier based on developments since then. After a very strong ADP employment report on April 5th, most everyone was expecting a solid nonfarm payrolls report two days later. That never materialized, though, as the consensus was for 175,000 jobs to be reported. Estimates ranged from 125,000 to 202,000, yet the actual number reported was 98,000. That disappointment occurred when the Volatility Index ("VIX") had closed at 12.39 the previous day. A low VIX reading (and a VIX in the 12s is a low reading historically) means the market is not expecting much volatility looking out the next month or two. Bad news in a low VIX environment typically is ignored. That's one reason that the S&P 500 closed down just two points on the day of the awful jobs report.
Fear is growing, however. Thursday marked the 6th consecutive session of higher highs and higher lows on the VIX and is now nearly 50% higher than it was a little more than a week ago. A VIX close to 16 can trigger much larger selloffs and it was unnerving to see how the market reacted to mostly very solid bank earnings reports on Friday morning. Here's the parade of earnings that we saw:
Citigroup (C): Revenues of $18.12 billion (vs. $17.86 billion est) and EPS of $1.36 (vs. $1.24 est)
PNC Bank (PNC): Revenues of $3.88 billion (vs. $3.77 billion est) and EPS of $1.96 (vs. $1.84 est)
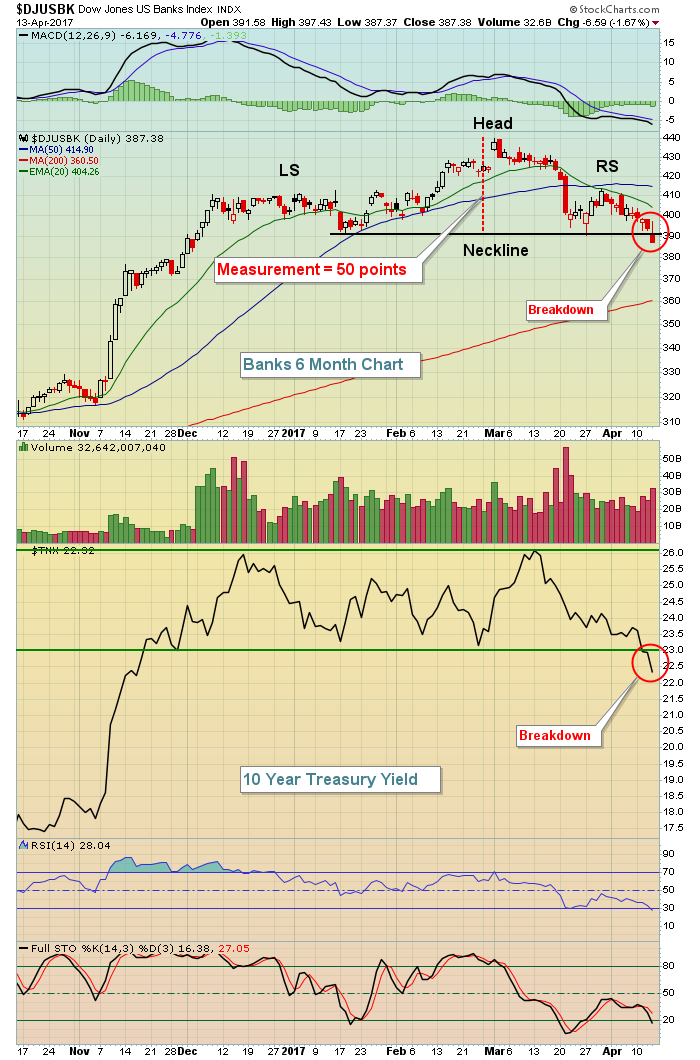
JP Morgan (JPM) easily beat its EPS expectations ($1.65 vs. $1.51) as did Wells Fargo (WFC, $1.00 vs. $.97), but both failed to meet revenue estimates. JPM fell very slightly below its expectations but WFC fell quite a bit short. To me, it's the reaction to news that's most important, not the news itself. Despite mostly very strong results from component banks, the Dow Jones U.S. Banks Index ($DJUSBK) lost neckline support as the 10 year treasury yield ($TNX) failed to hold its key yield support level as well. Check out both of these breakdowns:
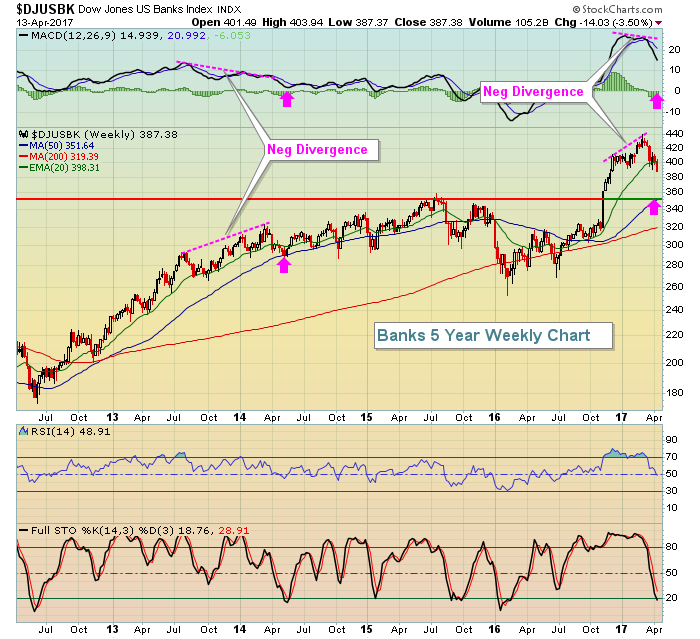
 This breakdown in the DJUSBK represents the potential for much more technical damage as a head & shoulders topping pattern has a measurement that's calculated from the head (440) to the neckline (390), or 50 points. That would "measure" down to 340 on the DJUSBK and the weekly chart would confirm a similar target. Take a look at this longer-term weekly chart:
 Longer-term price support resides near 350 and the weekly negative divergence is often followed by a MACD centerline reset and 50 week SMA test (pink arrows). You can see that negative divergence back in 2013-2014 resolved itself in similar fashion and I wouldn't be surprised if this setup does the same. For those in the bullish camp short-term for banks, I'd want to see a quick move back above 390 that holds and a 10 year treasury yield that quickly recovers back above 2.30%. Bank of America (BAC) will report its latest quarterly results on Tuesday, providing a possible catalyst to trigger buying in banks. Failure of BAC to derail the bears would very likely lead to a bank index that struggles mightily over the next few weeks.
Happy trading!
Tom
