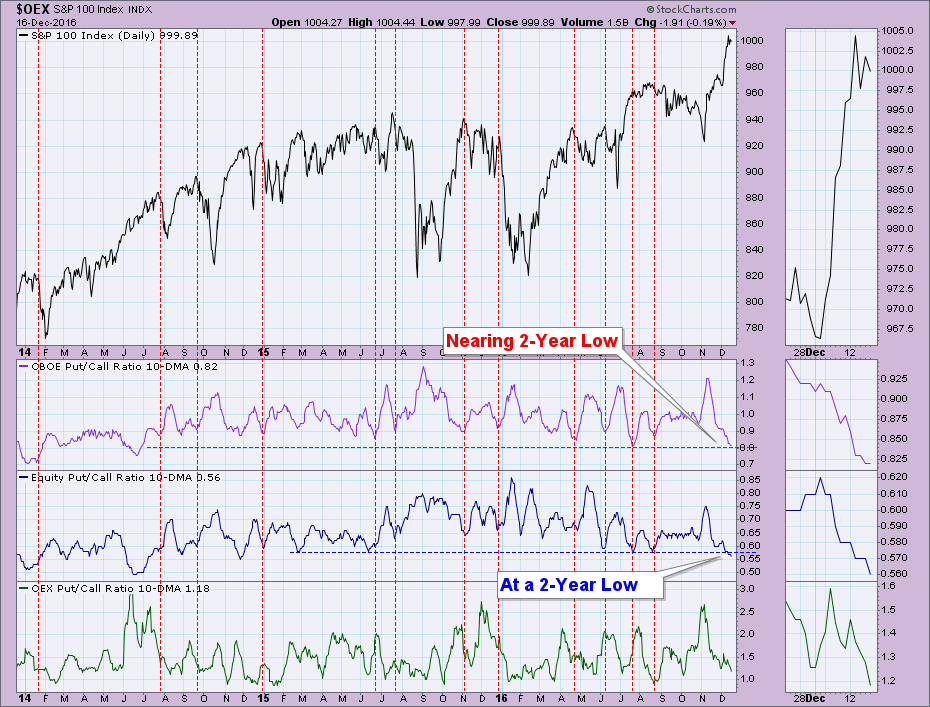
A webinar viewer recently sent me a chart showing put/call ratios nearing extreme lows. I pulled up the chart and indeed, the 10-DMA of the put/call ratios are nearing or are at two-year lows.
What does this actually mean? As the ratio gets smaller and smaller, that means that the amount of calls is accelerating faster than puts. When everyone is buying calls, that implies traders are extremely bullish. When everyone is very bullish, that is generally when the market reverses.
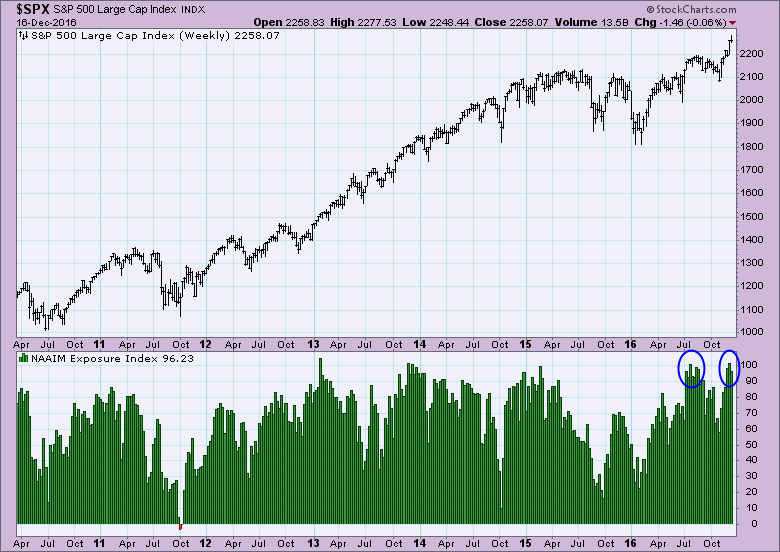
Looking at the National Association of Active Investment Managers (NAAIM) exposure to the market, we can see that they are near all-time highs. This would be another sign of bullish exuberance.
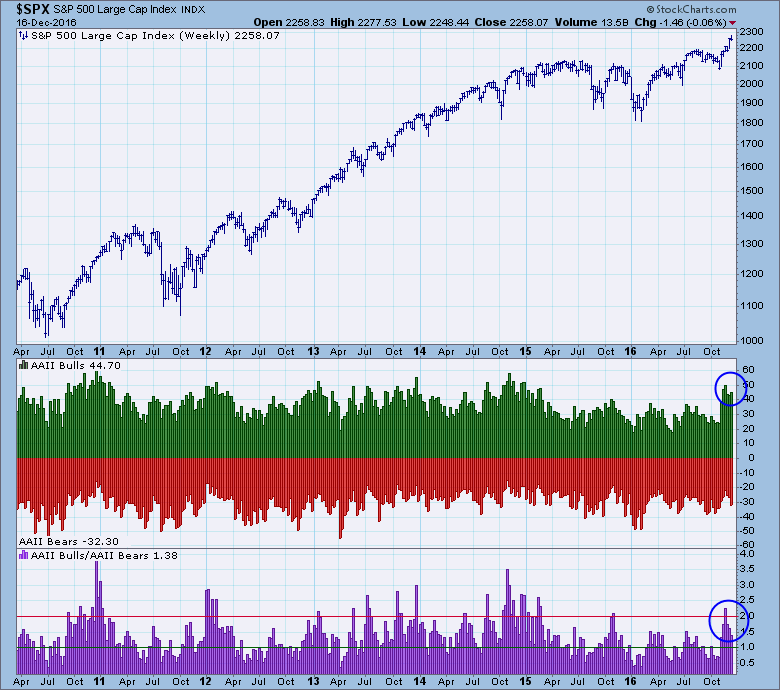
 The American Association of Individual Investors (AAII) is also hitting bullish highs. While there are still some bears out there to bring the ratio down somewhat, the actual percentage of bulls is high. This means the little guys are feeling very bullish right now.
Conclusion: Options traders, money managers and individual investors are all very bullish right now. Sentiment is a contrarian indicator, so the more bullish everyone is the more bearish the indicator. It isn't surprising to see these bullish numbers so high given the post-election rally, but they are reaching or have reached the danger zone.
The NEW DecisionPoint LIVE public ChartList has launched! Click on the link and you'll find webinar charts annotated just before the program. Additional "chart spotlights" will be included at the top of the list. Be sure and bookmark it!
Come check out the DecisionPoint Report with Erin Heim on Wednesdays and Fridays at 7:00p EST, a fast-paced 30-minute review of the current markets mid-week and week-end. The archives and registration links are on the Homepage under “Webinars”.
Technical Analysis is a windsock, not a crystal ball.
Happy Charting!
- Erin


