ChartWatchers August 20, 2016 at 08:56 PM
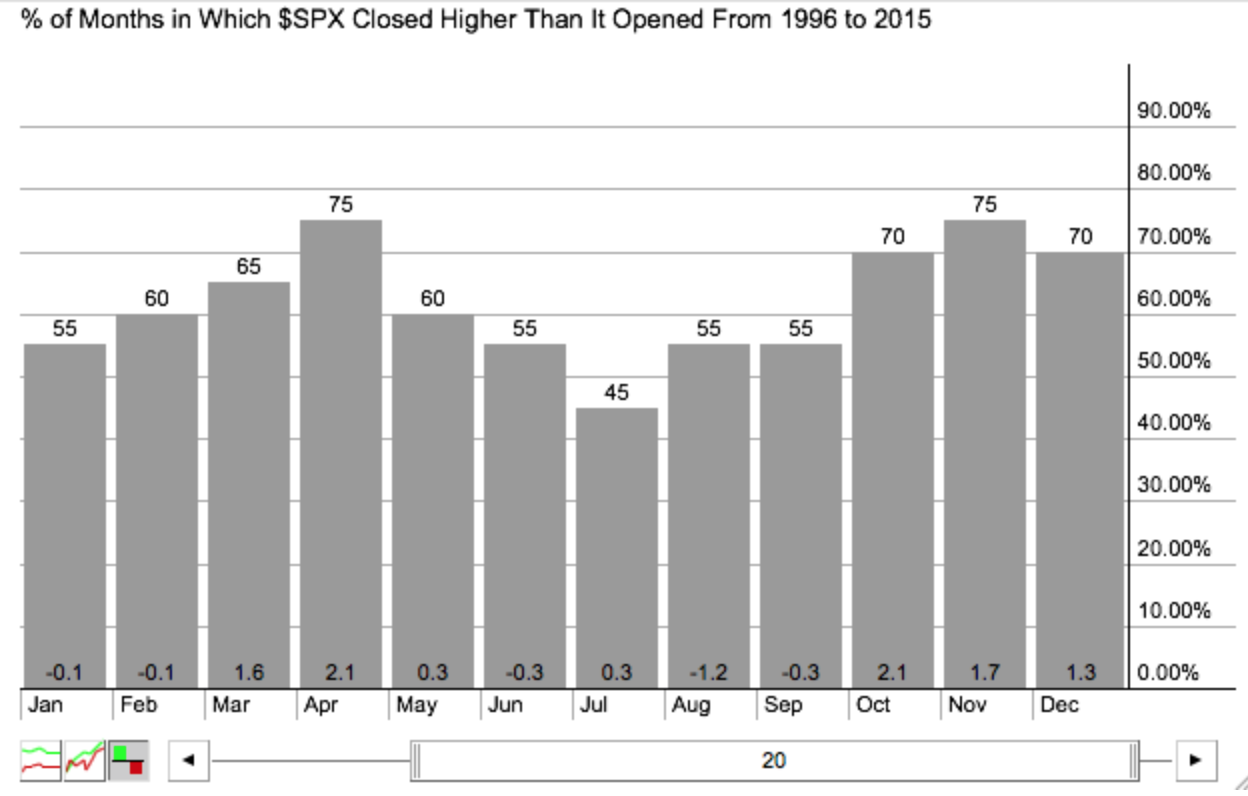
Hello Fellow ChartWatchers! Where is everybody? Things look pretty darn good on the weekly index charts: Stocks are at or near new all-time highs. The Tech sector is showing signs of life... Read More
ChartWatchers August 20, 2016 at 05:07 PM
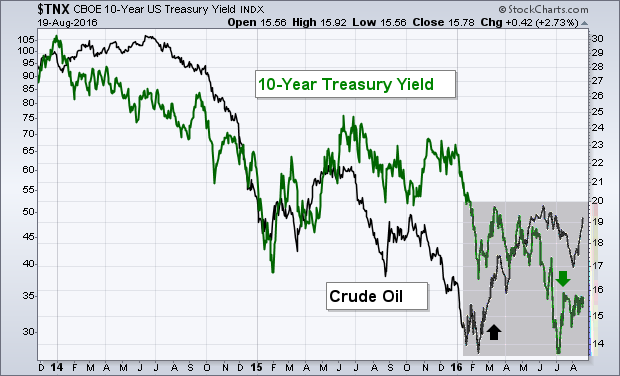
In more normal times, the direction of commodity prices, and oil in particular, had an impact of the direction of bond yields. That because oil is viewed as an early barometer of inflationary trends... Read More
ChartWatchers August 20, 2016 at 03:04 PM
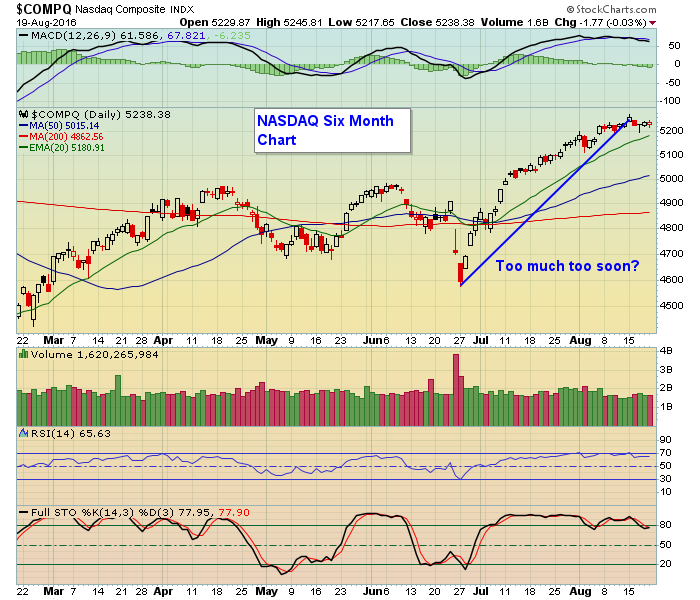
The latest earnings season has come and gone. Now what? It's a good question, especially with the market in stall mode, with the S&P barely budging in over a month... Read More
ChartWatchers August 20, 2016 at 11:08 AM
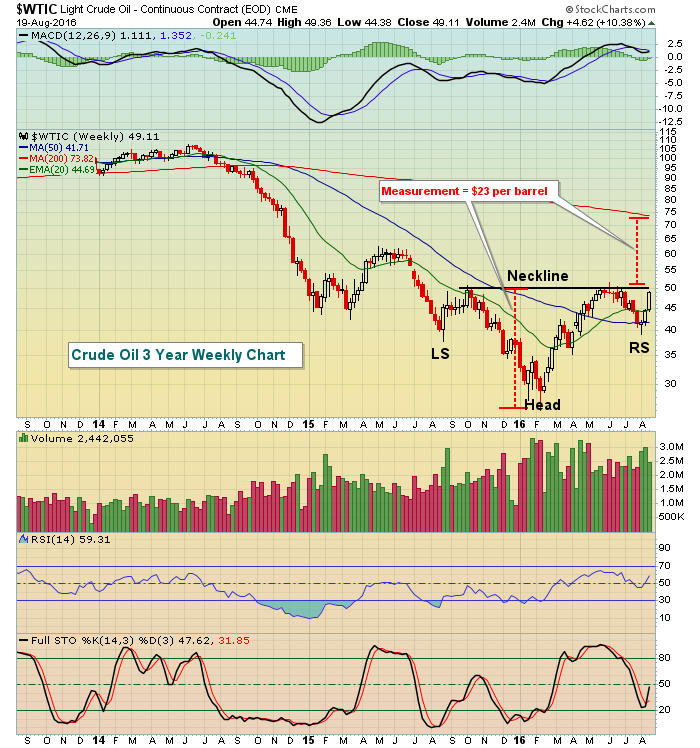
The bottoming formation in crude oil ($WTIC) continues to take shape and the beneficiary clearly has been the energy ETF (XLE). Since dipping below $40 per barrel to begin August, the WTIC has rallied more than 20% in the past three weeks and is now nearing $50 per barrel... Read More
ChartWatchers August 20, 2016 at 11:07 AM
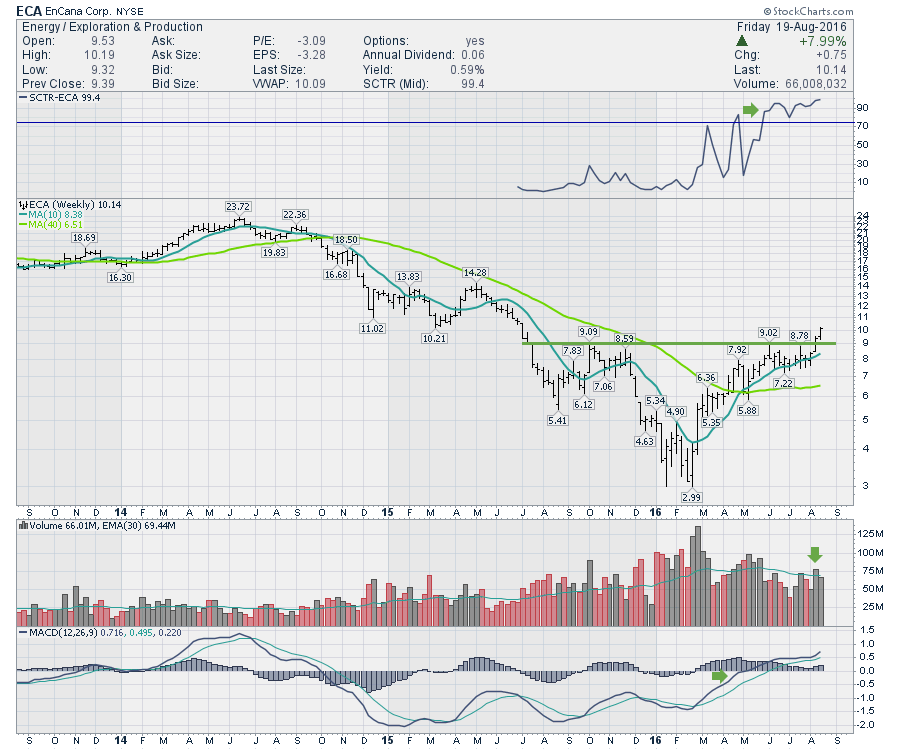
Long considered the ugly end of the energy business, the Natural Gas business is slowly starting to return. For those following the Commodities Countdown and Canadian Technician webinars, this will not be new... Read More
ChartWatchers August 20, 2016 at 08:59 AM
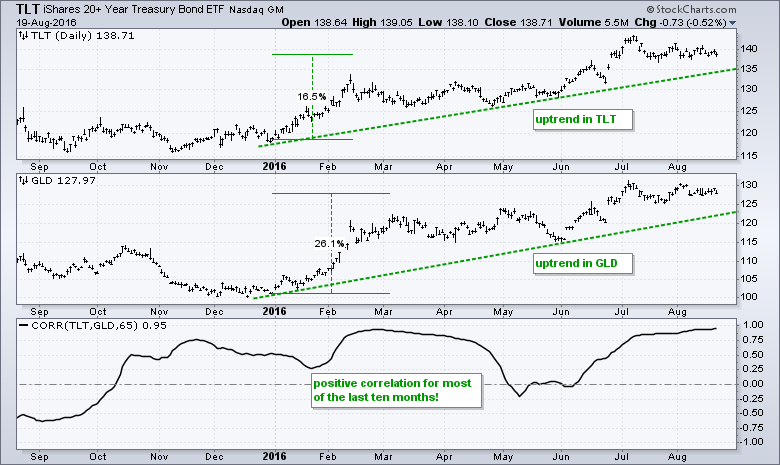
The Gold SPDR (GLD) and the 20+ YR T-Bond ETF (TLT) are two of the best performing asset class ETFs this year and both remain in clear uptrends. GLD is up over 26% year-to-date and TLT is up around 16%. One would not expect bonds and gold to be leading at the same time... Read More
ChartWatchers August 19, 2016 at 08:06 PM
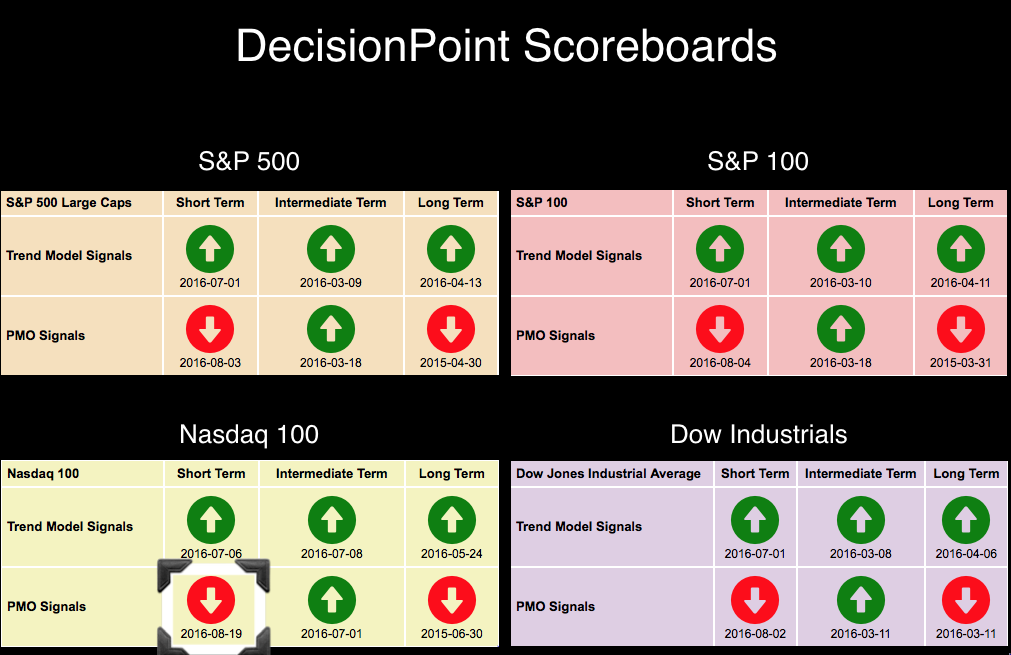
The DecisionPoint Scoreboards have been quiet since the beginning of the month when we saw the OEX, SPX and Dow all switch to short-term Price Momentum Oscillator (PMO) SELL signals. The NDX which has been enjoying a steep rally, has stalled... Read More
ChartWatchers August 06, 2016 at 06:06 PM
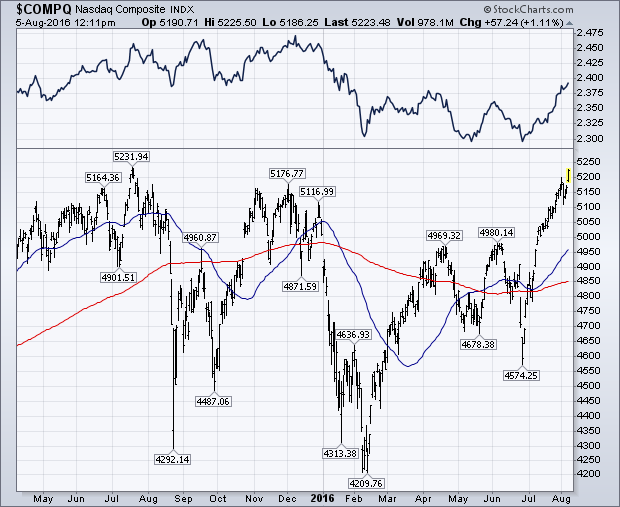
The Nasdaq Composite Index is on the verge of joining the Dow and S&P 500 in record territory. The first chart below shows the $COMPQ trading at the highest level in a year, and on the verge of clearing last July intra-day peak at 5232... Read More
ChartWatchers August 06, 2016 at 05:59 PM
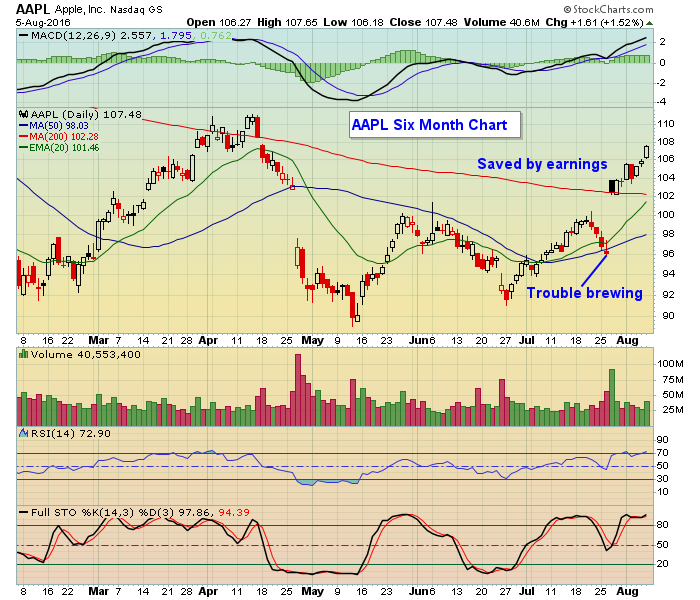
The market has seen both the Dow and S&P hit record highs recently and now the NASDAQ wants to join the party... Read More
ChartWatchers August 06, 2016 at 01:06 PM
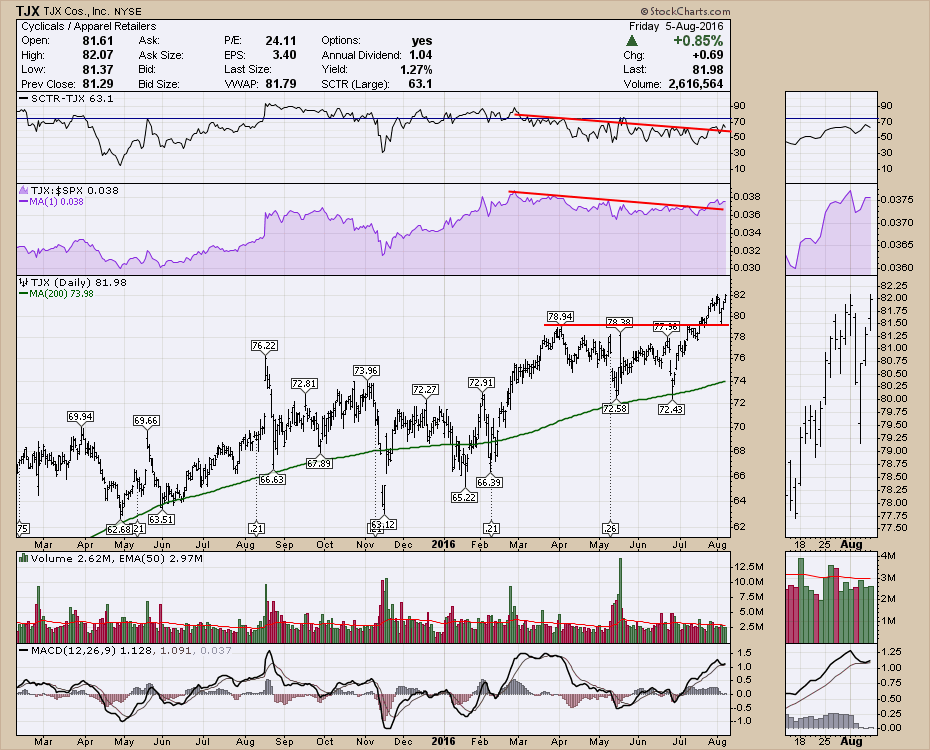
Some of the retail stocks are performing well, but it is a mixed bag. TJX (TJX) continues to hit new highs, but last year's big winner L Brands (LB) is one of the worst. So from the church of what is working lately, we turn to the SCTR's to help rank the Consumer Cyclicals group... Read More
ChartWatchers August 06, 2016 at 11:31 AM

Hello Fellow ChartWatchers! So as I write this, I’m crammed into seat 18F on the red-eye back to Seattle. I can barely type on my laptop thanks to the wonderful people all around me... Read More
ChartWatchers August 06, 2016 at 01:51 AM
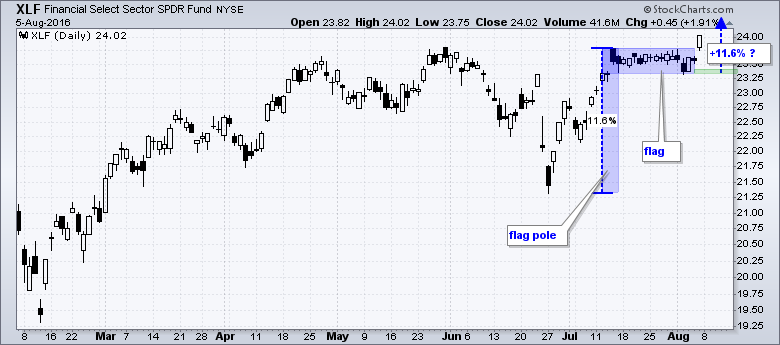
Before looking at some patterns and breakouts, let's first review the basic of the flag pattern. Flags are continuation patterns that depend on the prior move for a directional bias... Read More