There is no denying it, the market experienced an amazing rally this past week after the waterfall correction initiated by Brexit. Now prices are where they were before the landmark vote. The question is whether this rally will persist now that price is reaching strong overhead resistance once again.
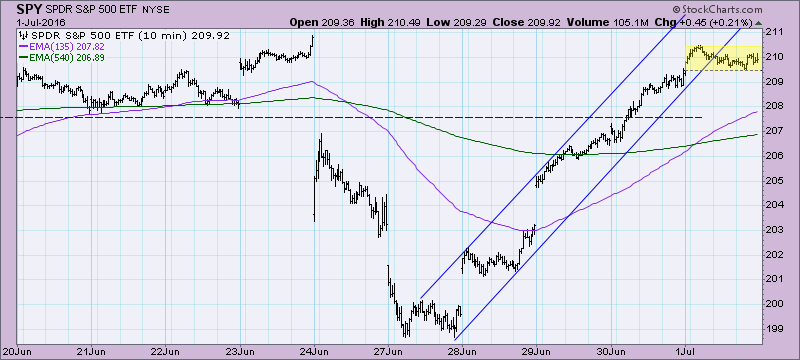
Looking at the 10-minute bar chart for the SPY, note that the rising trend was interrupted today and price consolidated, moving outside of the rising trend channel.
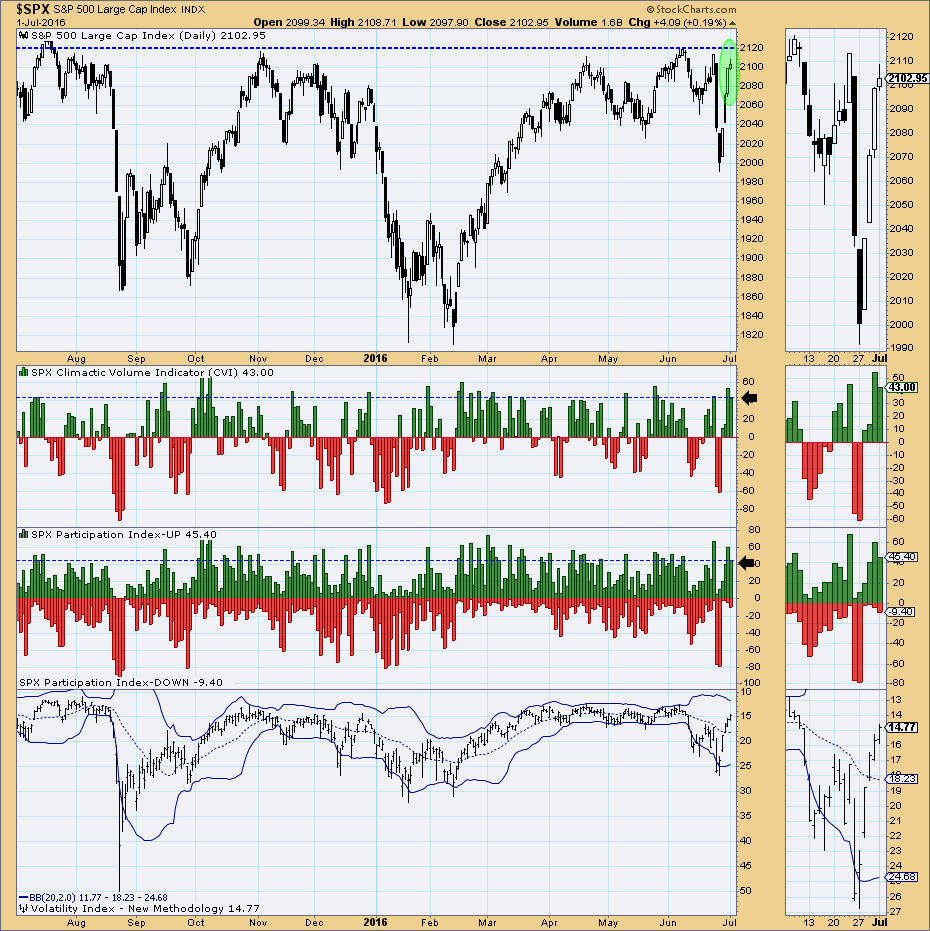
The ultra-short-term indicators are suggesting a buying exhaustion is in play. Note the climactic spikes on the CVI and Participation Index - UP. When we get 'spikes' in the readings on these indicators, we classify them as exhaustions or initiations. Yesterday's spike read as a buying exhaustion and with today's consolidation and follow-on climactic readings (that were slightly less than yesterday's), I believe the buying exhaustion is being confirmed. Remember that these indicators are in terms of hours to days, so look for more consolidation or lower prices next week.
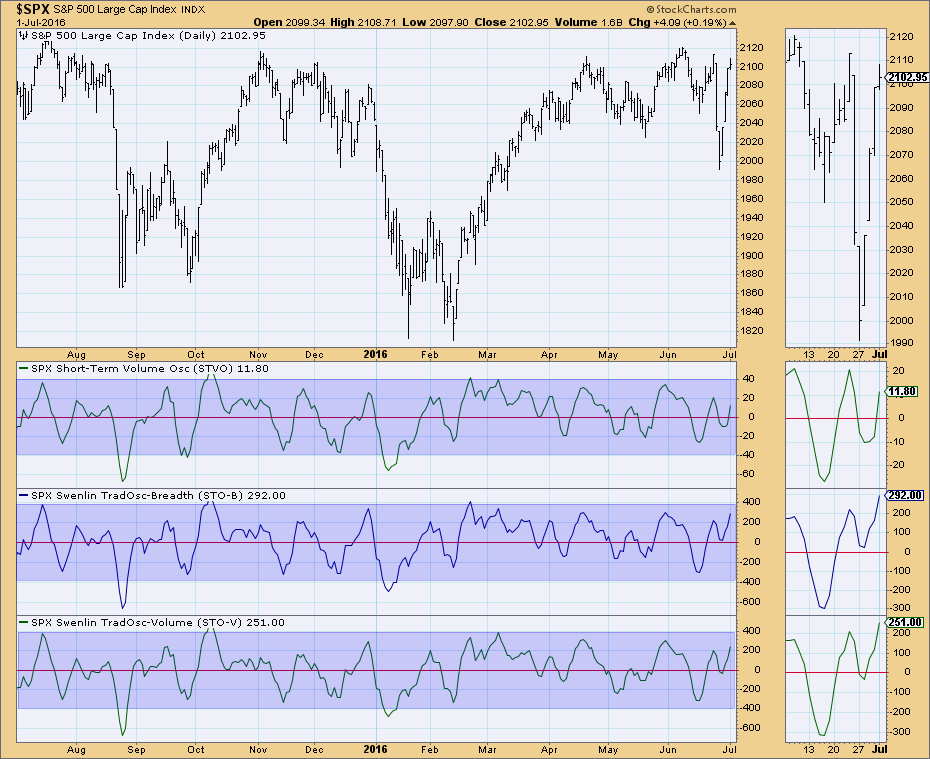
Additional confirming evidence of a buying exhaustion appears on the short-term indicator chart. Note that all of these indicators are near the top of their range. They will be looking to decompress and the best way for that to be accomplished is consolidation or decline.
Conclusion: With price nearing overhead resistance at all-time highs once again, conditions need to be ripe for a breakout. Ultra-short- and short-term indicators are suggesting lower prices in the short term which doesn't support the idea of a rally past overhead resistance.
Come check out the DecisionPoint Report with Erin Heim on Wednesdays and Fridays at 7:00p EST, a fast-paced 30-minute review of the current markets mid-week and week-end. The archives and registration links are on the Homepage under “What’s New”.
Technical Analysis is a windsock, not a crystal ball.
Happy Charting!
- Erin


