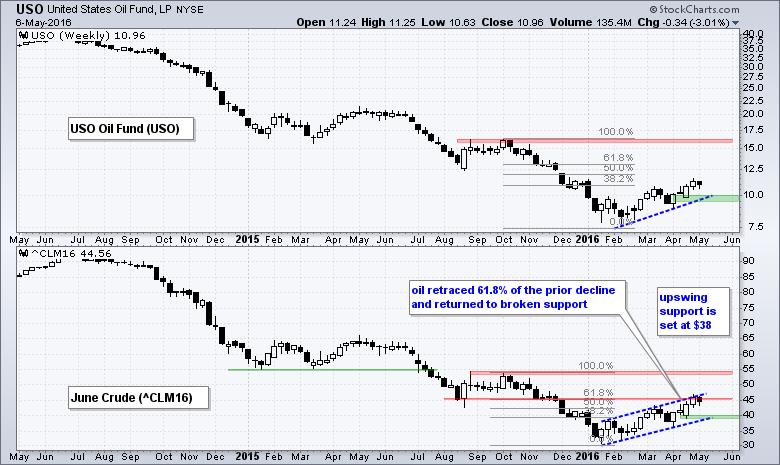
Oil remains in an uptrend this year, but the bigger trend remains down and this could be just a counter-trend bounce. The price chart shows the USO Oil Fund (USO) in the top window and June Crude (^CLM16) in the bottom window. I am using June Crude for analysis because it is the pure play on oil.
Crude advanced around 50% in four months, but this advance still pales relative to the bigger downtrend and the prior decline. Note that oil fell around 40% from October to January. This down-up sequence highlights an important aspect of trading. Namely, it takes a 100% advance to recover from a 50% decline (i.e. 100 to 50 and back to 100). On the price chart, notice that June Crude is near the 61.8% retracement and broken support. A classic tenet of technical analysis is that broken support turns into subsequent resistance. The 61.8% retracement is a Fibonacci level that marks a potential reversal zone. Taken together, this suggests that further upside could be limited.
Despite potential resistance and a possible reversal zone, crude is not showing any weakness just yet and the immediate trend is clear up. The blue channel lines define the 2016 uptrend with support marked at $38. Even though this could be a counter-trend rally, this medium-term trend appears to be the dominant force right now so we need to wait for some sort of bearish indication, such as an outside reversal week.
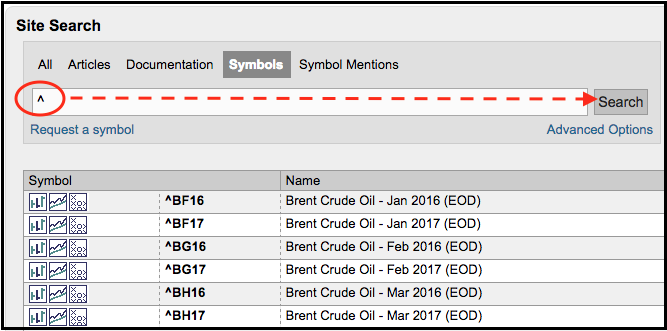
Looking for more futures symbols at StockCharts? Simply search the symbol catalog for a caret (^). All futures symbols are updated after the close and begin with a caret.
Follow me on Twitter @arthurhill - Keep up with my 140 character commentaries.
Thanks for tuning in and have a good weekend!
--Arthur Hill CMT
Plan your Trade and Trade your Plan
*****************************************


