Two weeks ago I featured the NYSE McClellan Oscillator ($NYMO) and the Nasdaq McClellan Oscillator ($NAMO) as they surged to their highest levels in years. These breadth indicators are very broad and represent virtually all stocks traded in the US. Big moves in both breadth indicators signaled a bullish breadth thrust. Today, I am turning my attention to new highs for the NYSE and Nasdaq to see if strength is broadening. If you are looking for leaders, look no further than the new high list. Stocks hitting 52-week highs are in obvious uptrends and clearly leading the market.
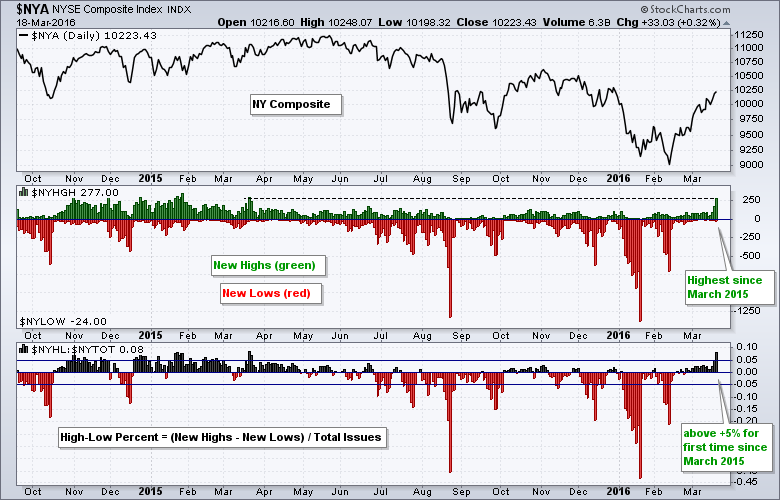
The first chart shows new highs and new lows as an up-down pair. I will show an image with the SharpChart settings at the end of this commentary. NYSE New Highs ($NYHGH) exceeded 250 for the first time since March 2015. Also notice that High-Low Percent moved above +5% for the first time since March 2015. Thus, the rally is broadening within the NYSE as more stocks record new highs. Utilities, consumer staples, industrials and REITs accounted for most of the new highs.
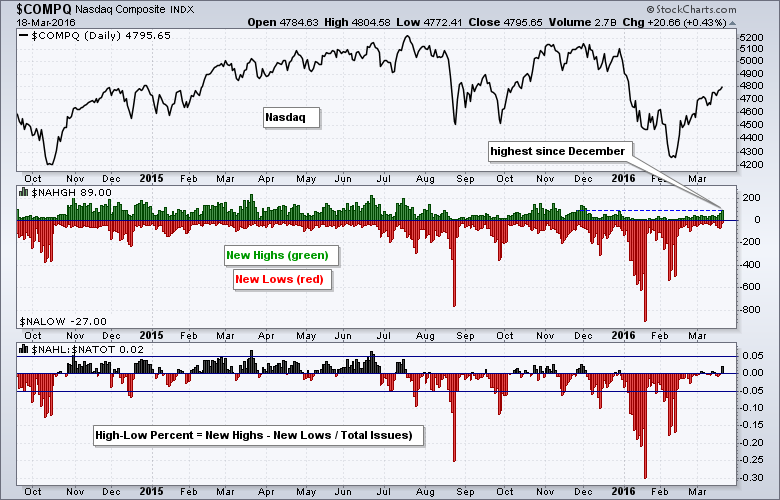
The second chart shows the same indicators for the Nasdaq. First, notice that new highs are not as strong as on the NYSE and they are back near their December levels. Second, notice that High-Low Percent moved to +2% and remains well short of the +5% threshold. Nasdaq High-Low Percent has not been above +5% since June. Thus, the Nasdaq still has some work to do. New highs of note included 24 bank stocks, 15 industrial stocks and 10 semiconductor stocks.
 The image below shows the chart settings used to create this SharpChart. I selected "Price - Up/Down Pair" as an indicator and entered the high-low symbols in the parameters box ($NYHGH,$NYLOW). For High-Low Percent, I selected "Price" as the indicator and entered a ratio in the parameters box ($NAHL:$NATOT).
 ****************************************
Thanks for tuning in and have a good weekend!
--Arthur Hill CMT
Plan your Trade and Trade your Plan
*****************************************

