There are no guarantees to this question, but we do have history and past technical indications to provide us a few guidelines. Trading strategies applied during a bull market simply won't work during a bear market. They may work on a few select industry groups and stocks, but the game has changed for most areas of the market and we have to change with it. So let's start with a few basic rules I follow:
1. High growth stocks become extremely dangerous to own on the long side
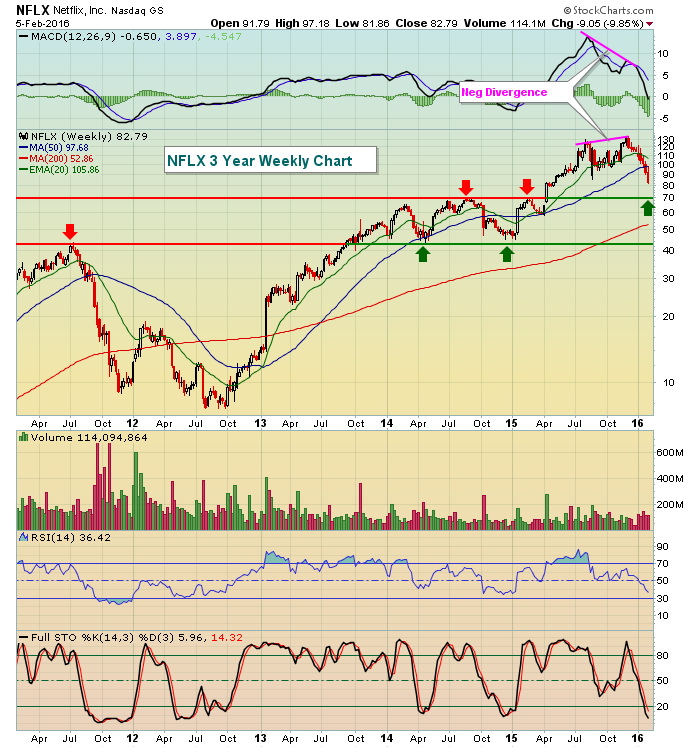
Netflix (NFLX) is a great example. During the 7 year bull market, NFLX rose from 5 bucks to its December 2015 high of 133. During the past two months, NFLX has lost nearly 40% and closed Friday at just 82. These high-flyers get crushed as money rotates to safer investments. If you're going to own stocks like NFLX during a weak or bearish market environment, you have to study the charts, find strong support levels and have the patience necessary to allow them to reach price support.
2. Keep tight stops in play, especially on the long side
Let's continue the discussion on NFLX. On a long-term chart, I see an interesting area of support where I'd consider trading NFLX on the long side. It's near 70, another 15% lower from Friday's close. We certainly could see a sizable bounce in NFLX prior to reaching the 70 level, but it's difficult to predict where that bounce could take place from. Therein lies the major risk. If you buy NFLX at 82 and find yourself down 7 bucks on it next week, emotional trading ramps up and then you're in big trouble. Oversold conditions can become more oversold in a bear market. Remember, this isn't a bull market any longer - at least not based on the signals I've been seeing the past few months.
So let's look at the NFLX chart:
 A negative divergence printed on the weekly chart on its most recent price high, a bearish sign in itself. That suggested buying momentum was waning and it certainly proved to be a solid warning signal. Looking back, however, we can see there was serious price resistance in 2014 and early 2015 near 70 that was cleared with a very heavy volume candle that coincided with earnings in the second quarter of 2015. We haven't tested that breakout level so that would be one interesting entry point for a short-term trade on NFLX. In a bear market, I'd study the charts of any aggressive stocks you like, then only pull the trigger if that key level is hit. After pulling the trigger, I'd then have a very tight stop in place, perhaps in the 68-69 area to guard against big losses. As we've already seen, these aggressive stocks sell off fast. Pain is inflicted as quickly as possible and that enables market makers to benefit from emotional trading.
3. Understand the limitations of the sectors you're investing in
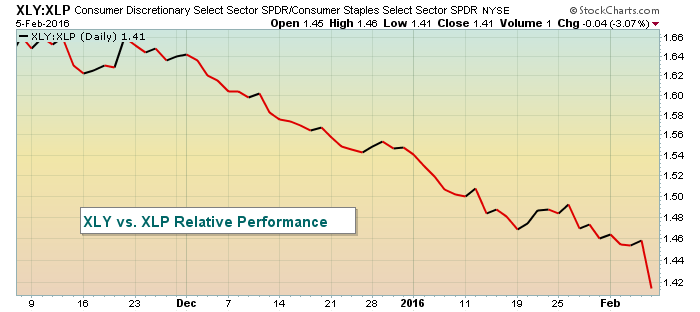
Sticking with the NFLX theme here, you must understand you're trading a consumer discretionary (XLY) stock. Currently, this sector is getting trounced. Nowhere is it more evident than by comparing the XLY vs. the XLP (consumer staples). Check out this chart:
 This should help to explain why stocks like NFLX are being crushed. Money is rotating very rapidly away from consumer discretionary stocks and into the more defensive consumer staples names. The market environment dictates that we do not want to own NFLX. Of course that can change from time to time, but buying the stock and hoping the reversal will happen right now is not a very good bear market strategy.
4. Beware key resistance on the major indices
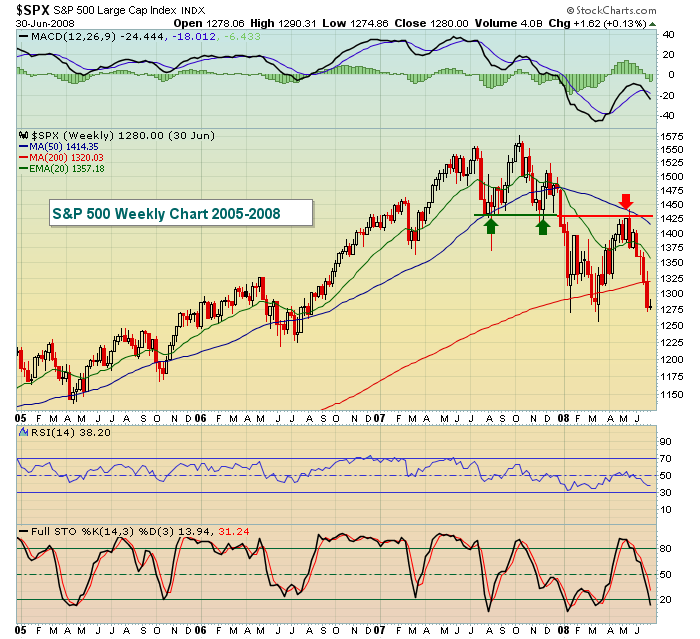
During bull markets, price support and key moving averages rule in terms of where key price reversals generally take place. To understand bear markets, you simply need to turn your computer monitor upside down. Now it becomes price resistance and key moving averages. Let's look at the early stages of the last bear market that began in 2007 to illustrate:
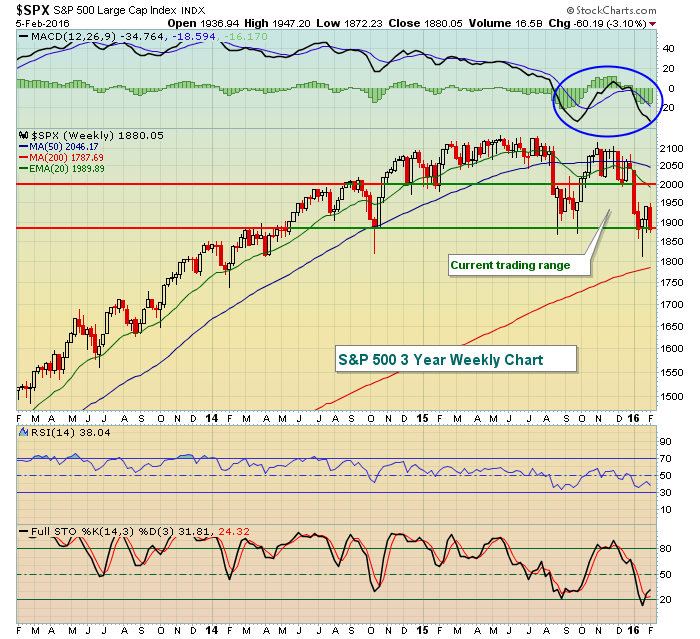
 Prior support becomes resistance as the green arrows and red arrow demonstrate. Be careful expecting too much from rallies. Make the market prove that the bear market has ended, don't assume it. Check out the look of that weekly MACD as it fails to move above key centerline resistance and then rolls over. Now let's look at current conditions on the S&P 500 weekly chart as of Friday's close:
 The good news for the bulls is that price support is still holding. Unfortunately, that's about where all the good news ends. Money keeps rotating toward defense and that suggests to me that it's only a matter of time before price support is lost. There's a chance that we remain in a 100 point trading range a bit longer, although I expect support will be lost before we reach 1995 price resistance in the range. Should support be lost, then the 1850-1900 price range will become price resistance while the declining 20 week EMA, currently at 1990, will provide the next line of defense for the bears should price resistance be cleared.
I believe the bear market has arrived. Job #1 during a bear market is capital preservation so try to remain objective about the big picture outlook and don't focus on the high volatility and big price swings we're likely to endure. That leads to emotional trading and, many times, losses.
Happy trading!
Tom
