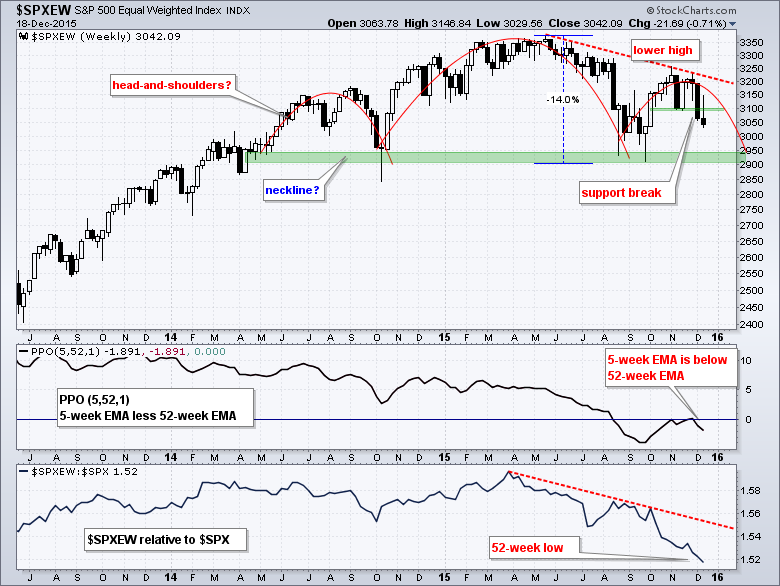
The S&P 500 Equal-Weight Index ($SPXEW) continues to underperform the market-cap weighted S&P 500 and its downtrend resumed with a break down in mid November. On the price chart, the index broke below its mid November low with a long black candlestick, made an attempt to recover this past week and failed with a close near the low of the week. The October-November bounce formed a lower high and looks like a counter-trend bounce. In other words, the decline from 3400 to 2950 (-14%) looks like the dominant move and the advance back to 3250 looks like a corrective bounce within a bigger downtrend. Overall, it looks like a large head-and-shoulders pattern is taking shape with neckline support in the 2900-2950 area.

The indicators confirm the downtrend and relative weakness. The first window shows the Percentage Price Oscillator (5,52,1), which measures the difference between the 5-week EMA and the 52-week EMA. The PPO is negative when the 5-week is below the 52-week and positive when it is above. The PPO dipped deep into negative territory in August-September, recovered to the zero line in October and edged above zero in late November. This cross did not last long as the indicator turned back down and went negative the last two weeks. This confirms that the 5-week EMA is below the 52-week EMA and the trend is down. The second window shows the price relative ($SPXEW:$SPX ratio) hitting a new low this week as the equal-weight S&P 500 continues its chronic underperformance.
****************************************
Thanks for tuning in and have a good weekend!
--Arthur Hill CMT
Plan your Trade and Trade your Plan
*****************************************
