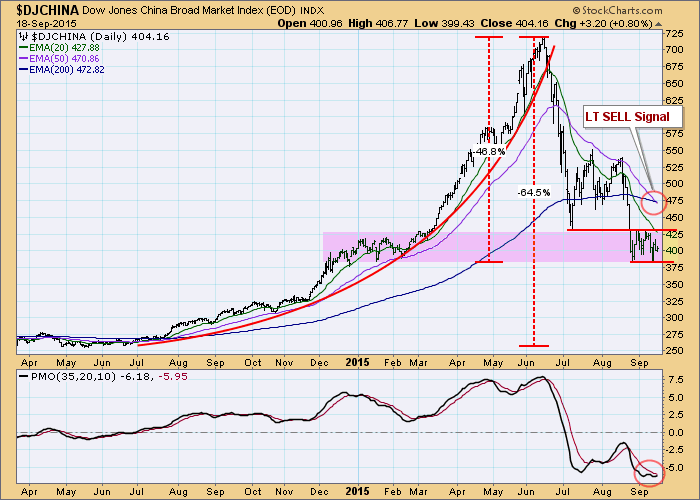
This week the DecisionPoint Long-Term Trend Model generated a long-term SELL signal for $DJCHINA, but it was a tad late, considering how far that index has fallen. This chart provides us with a good example of when mechanical signals need to be ignored.
In this particular case, $DJCHINA experienced a parabolic rise that ended in June. This rapid price rise caused the moving averages to spread abnormally far apart, so that, when price reversed downward, crossover signals were delayed beyond any usefulness. For example, when the 50EMA crossed down through the 200EMA generating a long-term SELL signal this week, price had already fallen nearly -50%. Nevertheless, this is not a critical issue, because we only use the Long-Term Trend Model as an objective method of identifying the long-term market environment, not for actual trading signals. In this case price movement over the last three months provided us with early and obvious evidence of China's troubles. And, when trading a parabolic, trailing stops are more effective protection.
Currently, $DJCHINA is consolidating in a zone of congestion that is providing support, and the PMO double bottom is matching the double price bottom. This could be a setup for a reaction rally, similar to the one in July; however, the long-term SELL signal says that the bear market environment will work against any sustained upside price movement. Also, when parabolic advances break down, our expectation is that price will return to the basing pattern that preceded the parabolic advance. For $DJCHINA, that is about 260.

