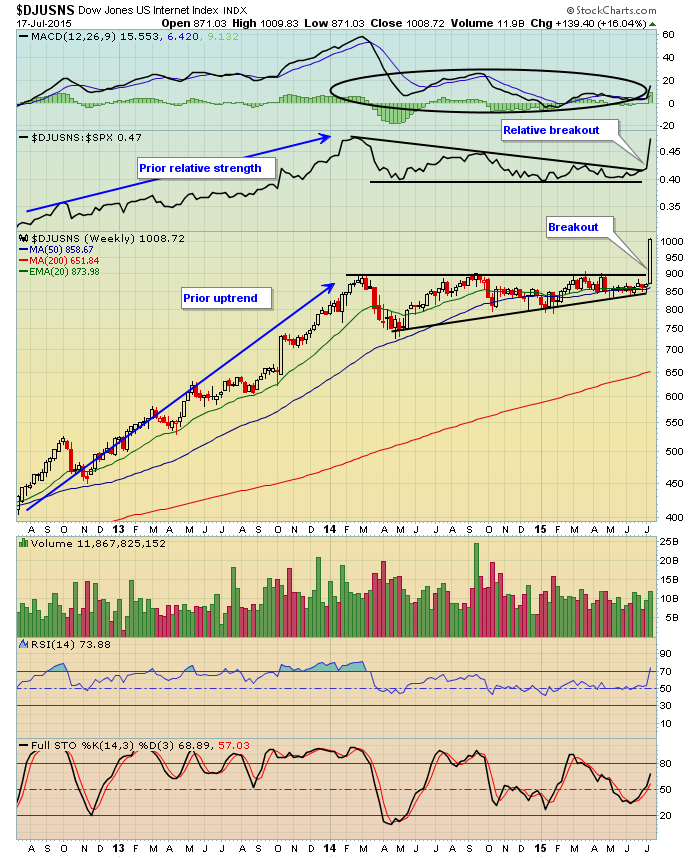
There's a reason we watch chart patterns. Earlier this week in a DITC blog article, the internet index ($DJUSNS) finally cleared 900 resistance after failing at that level on a few occasions the past 18 months. This latest attempt was different, however. Many times it gets quite frustrating as continuation patterns develop. The "I need to make money right now" crowd gets very impatient and loses faith in sectors or industry groups as they underperform for periods of time as money rotates within the market. Those who use technical patterns simply bide their time. What is lost is that the DJUSNS had a parabolic move higher BEFORE the consolidation pattern took place. Check out the chart for this group:
There are a few points to be made here. First, note that the breakout above 900 actually took place earlier in the week BEFORE Google's (GOOGL) big earnings report on Thursday after the bell. Technical analysis provides us clues in many cases and this certainly was one of those cases. Second, look at how long the DJUSNS consolidated in that ascending triangle pattern. Third, we always have to be mindful of parabolic rises because they are often followed by continuation patterns that can take many months to take shape - just as the DJUSNS did. Fourth, check out the relative strength of the DJUSNS vs. the S&P 500 during that 18 month consolidation period. While the DJUSNS remained in a bullish continuation pattern, it was NOT where you wanted your money to be as we awaited confirmation of the pattern. Finally, all of that consolidation enabled the weekly MACD (black circle) to move back to its centerline support. Now the move higher is likely to be supported by moving averages during any period of selling. I look for the DJUSNS to remain in favor for several months with pullbacks representing opportunities for entry along the way.
Happy trading!
Tom

