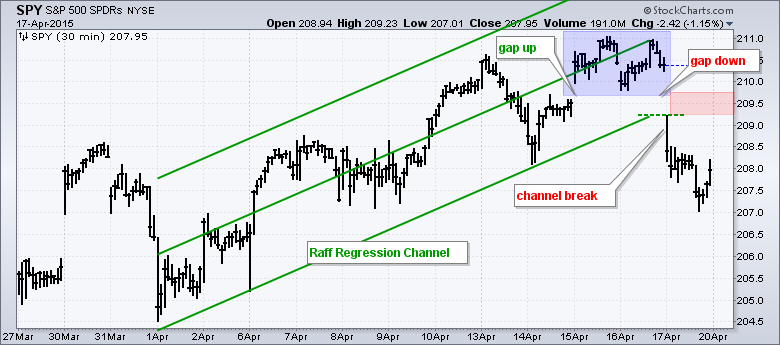
With a gap up and a gap down, the S&P 500 SPDR (SPY) formed an island reversal over the last four days. This is short-term bearish, but not enough to affect the longer trend, which is still up. To emphasize the short-term nature of this reversal, I am going to start with a 30 minute bar chart. The Raff Regression Channel defines the short-term uptrend extending up from April 1st to April 16th. SPY gapped up on April 15th, held this gap for two days, and then gapped down on April 17th. The blue zone represents a price island above both gaps. Traders establishing long positions on the island are now trapped with losses. The short-term uptrend clearly reversed as SPY broke the lower line of the Raff Regression Channel as well. Broken support and the gap zone become first resistance in the 209.50 area.
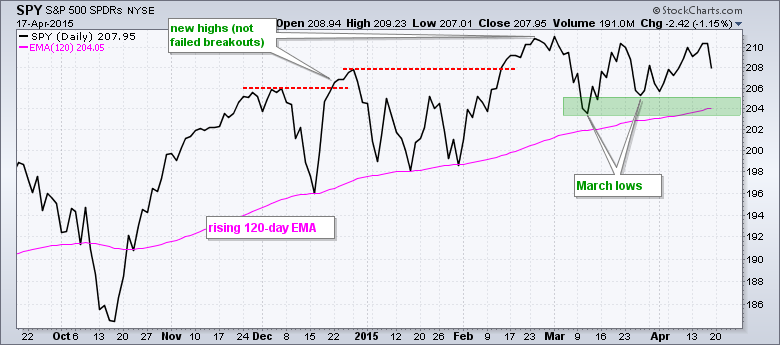
Now let's put this decline into perspective. The second chart shows closing prices for SPY over the last seven months. Even though Friday's decline was enough to reverse the short-term uptrend, the long-term uptrend remains in place and SPY is still less than 1% from its all time closing high. SPY is also above the rising 120-day EMA, which marked support in December and January. The ETF is currently consolidating with support in the 204-205 area and resistance in the 210-211 area. As with the January consolidation, this looks like a consolidation within an uptrend. In other words, a mere rest within the uptrend. The March lows and rising 120-day EMA mark the first support zone to watch for signs of significant selling pressure.


