Now that 2014 has drawn to a close, analysts are reviewing history and hoping to prognosticate about 2015. I'd like to review some of the DecisionPoint Trend Model charts for not just the S&P 500 (SPY), but also for the dollar, gold, oil, commodities and bonds. We can see what the current long- and intermediate-term Trend Model signals are going into 2015.
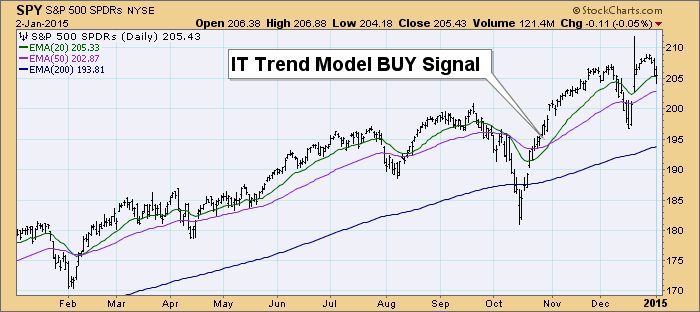
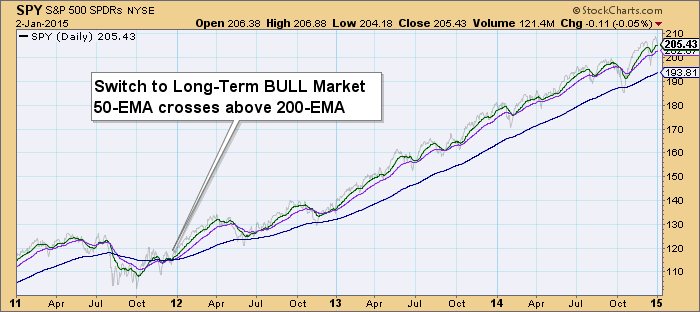
The intermediate-term Trend Model signal has been on a BUY since the 20-EMA crossed above the 50-EMA in October. We cannot see the long-term Trend Model's last signal change on this chart, but as long as the 50-EMA is above the 200-EMA it is in a bull market. The 2nd chart shows that the last time the 50-EMA was below the 200-EMA was in 2011. In the very long-term, we are very bullish and currently we are bullish in the intermediate term too.
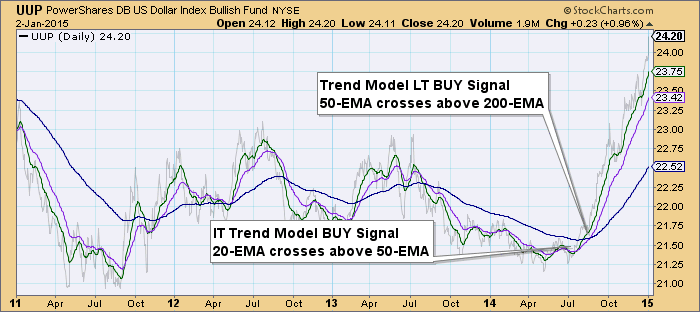
The dollar enjoyed a great rally in 2014 following a period of consolidation. Our long-term Trend Model moved to a BUY in the 3rd quarter of 2014 when the 50-EMA crossed above the 200-EMA. Just before that, the 20-EMA crossed above the 50-EMA generating an intermediate-term BUY signal. So DecisionPoint remains very bullish on the dollar closing out 2014.
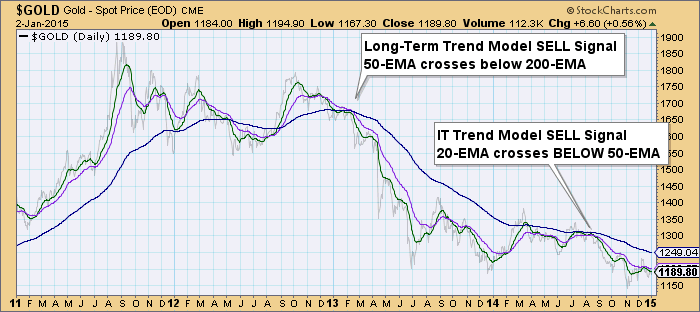
Gold has suffered which isn't surprising given the strength of the dollar. DecisionPoint's long-term Trend Model went on a SELL signal back in mid-2013. Since then there have been a number of intermediate-term Trend Model signal changes. Right now, the intermediate-term Trend Model is on a SELL signal generated in August.
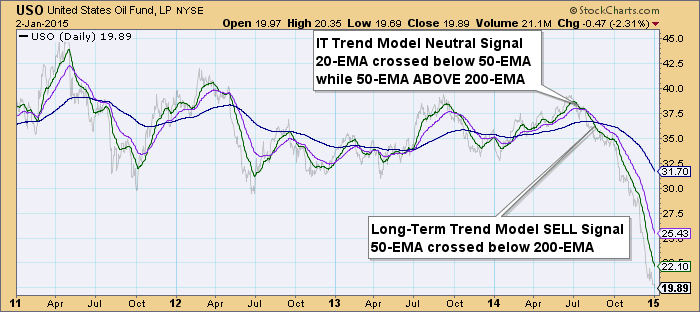
USO like Gold, took a hit this year, mainly due to the price of oil lowering due to an unexpected increase in supply due to fracking, among other factors. An intermediate-term Trend Model Neutral signal was generated when the 20-EMA dropped below the 50-EMA while the 50-EMA was above the 200-EMA. Had the 50-EMA been below the 200-EMA before that 20/50 crossover, it would have been a SELL signal. Given the very negative configuration of the EMAs, DecisionPoint remains very bearish regarding oil.
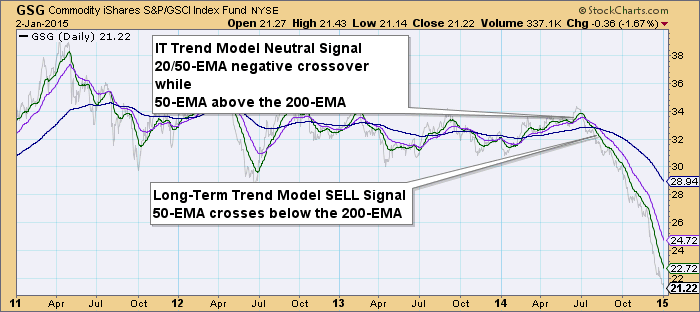
Commodities ETF (GSG) suffered like USO this year, again because of the strong dollar more than any other factor. The set-up is nearly identical to USO so we remain bearish on Commodities going into 2015.
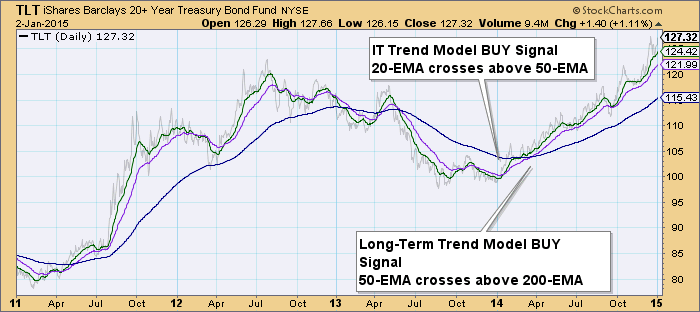
Finally looking at long bonds, TLT, DecisionPoint has been on an intermediate-term BUY signal since the beginning of 2014. This was followed by a long-term Trend Model BUY signal as the 50-EMA crossed above the 200-EMA. DecisionPoint is in the running for Timer Digest Bond Time of the Year by staying on a BUY signal for nearly the entire year. We remain bullish going into 2015.
So to conclude, here is the top of the table from the DecisionPoint Daily Alert Report which summarizes DecisionPoint's intermediate-term Trend Model positions. You can find this report in the DP Reports blog where it is published shortly after the market closes.
DECISIONPOINT ALERT DAILY REPORT
Friday, 1/2/2015

************************ DECISIONPOINT MARKET POSTURE ***********************

The following is the market posture suggested by our mechanical trend-
following tools. These are not trading recommendations, rather they are price
activity flags that should be qualified by chart analysis. The Trend Model is
used on all indexes.


                                     Days   Index     01/02   Points  Percent
Index               Posture     Date Elap  @Start     Close      P/L      P/L
------------------- ------- -------- ---- -------   -------  -------  -------
Stocks Medium-Term  Bullish 10/31/14   63   200.55   205.43    +4.88    +2.4%
Stocks Long-Term    Bullish 10/31/14   63   200.55   205.43    +4.88    +2.4%
Gold (NY Spot)      Bearish 08/21/14  134  1275.40  1186.20   +89.20    +7.0%
20+Yr T-Bond  (TLT) Bullish 01/17/14  350   102.43   127.32   +24.89   +24.3%
------------------- ------- -------- ---- -------   -------  -------  -------
Dollar Index  (UUP) Bullish 07/21/14  165    21.47    24.20    +2.73   +12.7%
Commodities   (GSG) Neutral 07/14/14  172    32.64    21.22     ....     ....
Crude Oil     (USO) Neutral 07/30/14  156    36.92    19.89     ....     ....
Happy Charting and Happy New Year!
Erin

