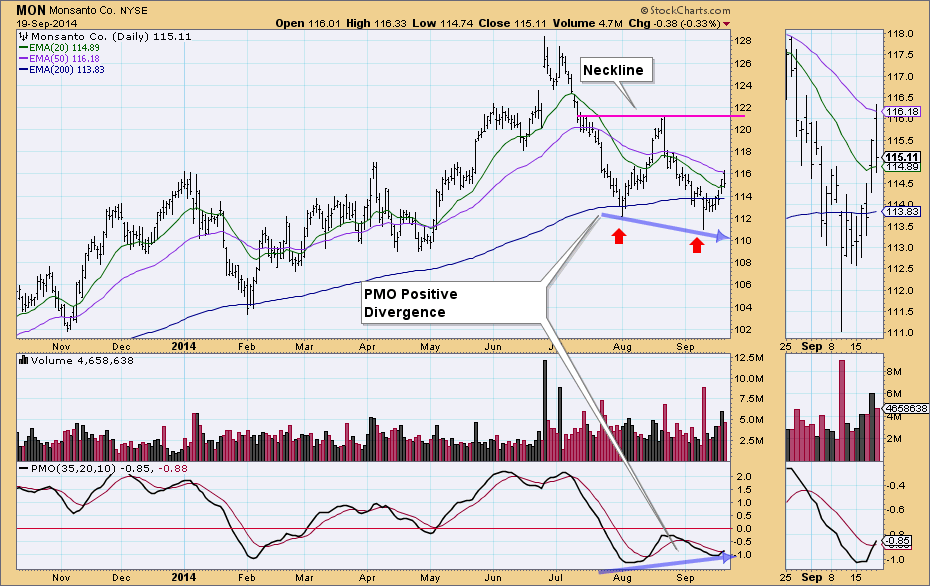
This afternoon while going over the DP Tracker Report for the S&P 500, I checked the new Price Momentum Oscillator (PMO) BUY signals on the SPX-Plus Tracker to see if there were any signals that looked promising. There was one--Monsanto (MON).
First glance at the thumbnail, we see the positive PMO crossover its EMA which generated the PMO BUY signal. What are the other positives about this chart? There is a positive PMO divergence, meaning that while price was making a lower price bottom, the PMO bottoms were rising. A PMO bottom in oversold territory is also favorable.
The bullish double-bottom formation was the other positive. This looks like a textbook start to a double-bottom formation. The neckline is what will take part in executing the pattern. Should price break above the neckline in a significant way, the expectation would be that price would rise the same amount that it did from the bottoms. In this case it would be about $10 which translates into a minimum upside target of approximately $131.
What are the negatives on this chart? The configuration of the 20/50/200-EMAs is not optimum. When the 20-EMA crossed below the 50-EMA at the end of July, that generated an Intermediate-Term Trend Model Neutral signal. It wasn't a SELL signal because the 50-EMA is above the 200-EMA which implies MON is in a long-term bull market. Good news is that price is above the 20-EMA so it is rising.
Happy Charting!
Erin

