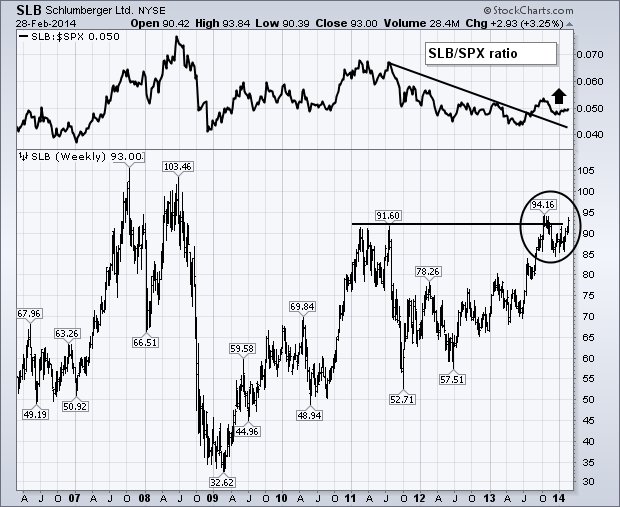
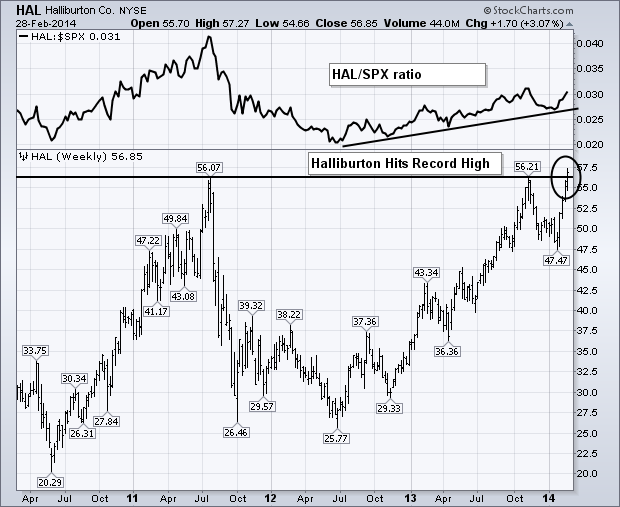
The two biggest stocks in the OIH also happen to be two of the strongest. The weekly bars in Chart 4 show Schlumberger (SLB) nearing a test of its fourth quarter high near 94. A close above that level would put the oil service leader at the highest level in six years. The SLB/SPX relative ratio (above chart) is also starting to rise for the first time since 2011 (when crude oil started to weaken). Halliburton (the second biggest OIH stock) has an even stronger pattern. Chart 5 shows Halliburton (HAL) ending February at a new record high after clearing previous peaks formed during 2013 and 2011. Its relative strength line (above chart) shows a nice uptick during the first two months of 2014. No doubt, rising oil prices have a lot to do with the stronger performance of both stocks.


