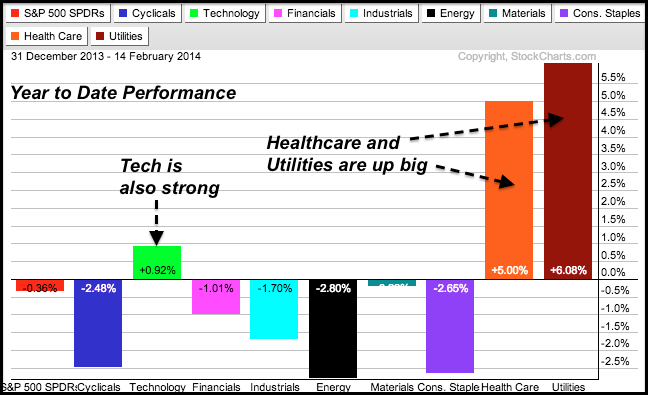
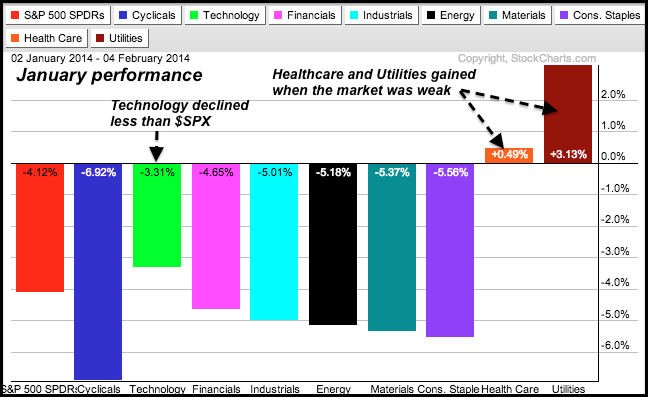
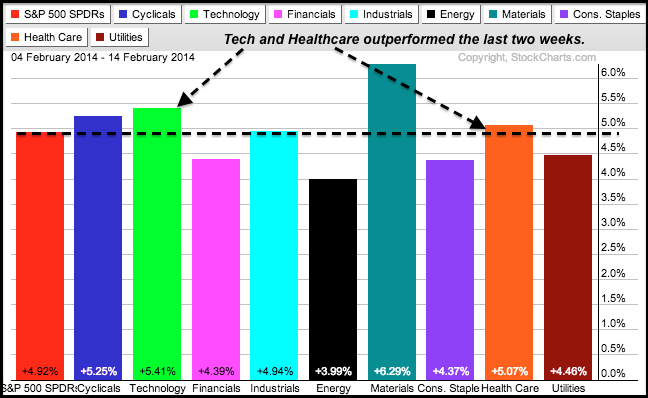
Chartists can find sectors with consistent performance by analyzing PerfCharts across different timeframes. The three PerfCharts show different performance periods for the S&P 500 and the nine sector SPDRs. I am looking at year-to-date performance and then dividing 2014 into two parts. The first part covers the period from January 2nd to February 4th, which is when the S&P 500 fell sharply. The second period covers February 4th to February 14th, which is when the S&P 500 rebounded. By looking at these three distinct periods, chartists can uncover which sectors show consistent relative strength and which show consistent relative weakness.

Year-to-date, we can see that the Technology SPDR (XLK), Utilities SPDR (XLU) and HealthCare SPDR (XLV) are the only sector SPDRs showing gains. These three show both absolute and relative strength. The Consumer Discretionary SPDR (XLY), Industrials SPDR (XLI), Materials SPDR (XLB), Energy SPDR (XLE) and Consumer Staples SPDR (XLP) are down more than the S&P 500 and show relative weakness. Even though healthcare and utilities are defensive sectors that typically lead when the market is in risk-off mode, note that the technology sector is also leading and this is positive for the market overall. Also notice that the consumer staples sector is lagging and this suggests that the market is not all that defensive.


The PerfCharts above show the breakdown for 2014. First, notice that healthcare and utilities gained from January 2nd to February 4th, which is when the S&P 500 declined. These two showed both absolute and relative strength. Talk about strong. Second, notice that the technology sector declined less than the S&P 500. This shows relative strength. Meanwhile, the consumer discretionary sector showed the most weakness with a 6.92% decline. The second PerfChart shows the gains over the last two weeks. Notice that technology and healthcare outperformed. These two are clearly the top two sectors in 2014. The utilities sector underperformed with a smaller gain, but a 4.46% advance ain't too shabby for high-dividend group and it is still the best performing sector for 2014. You can learn more about PerfCharts in these videos.
Good weekend and good trading!
Arthur Hill CMT
