I've maintained a bullish stance throughout this bull market, but I have to admit I'm beginning to get a little nervous. As a stock market historian, it's difficult for me to think bearish thoughts as we enter November because November, December and January are BY FAR the best consecutive months to be invested in the S&P 500. In fact, check this stat out. Since 1950, the period from the October 27th close to the January 19th close has risen 53 times out of the last 62 years, including 18 years in a row from 1983 to 2000. 25 different years have seen gains of 7% or more during this bullish period. This 10-11 week period has seen the S&P 500 rise MORE THAN 10% during 12 different years. If you get bearish now, you'll have history fighting you. It doesn't mean the market can't sell off, but the odds are clearly reduced.
Now that you have that bullish historical backdrop, consider the warning signs:
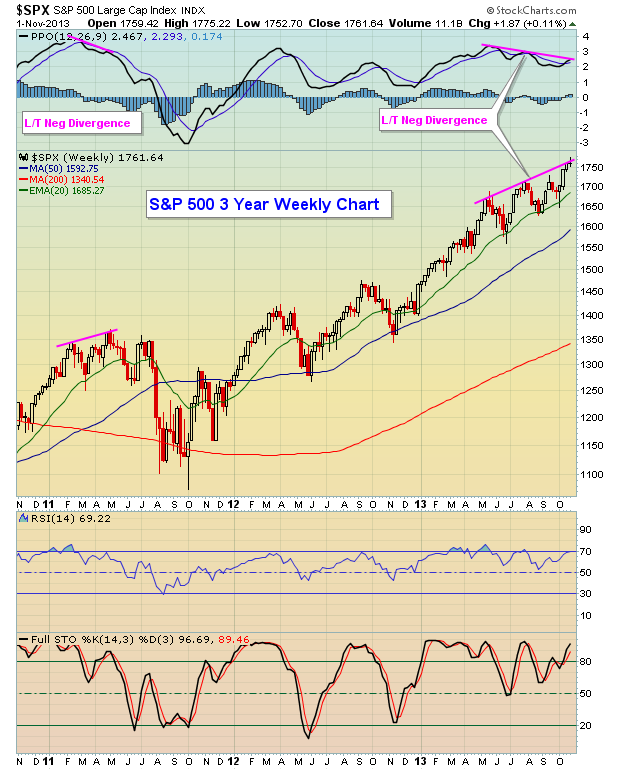
(1) We are violently overbought on weekly timeframes
(2) We have negative divergences on the weekly MACDs on 3 of our 4 major indices (NASDAQ is the exception)
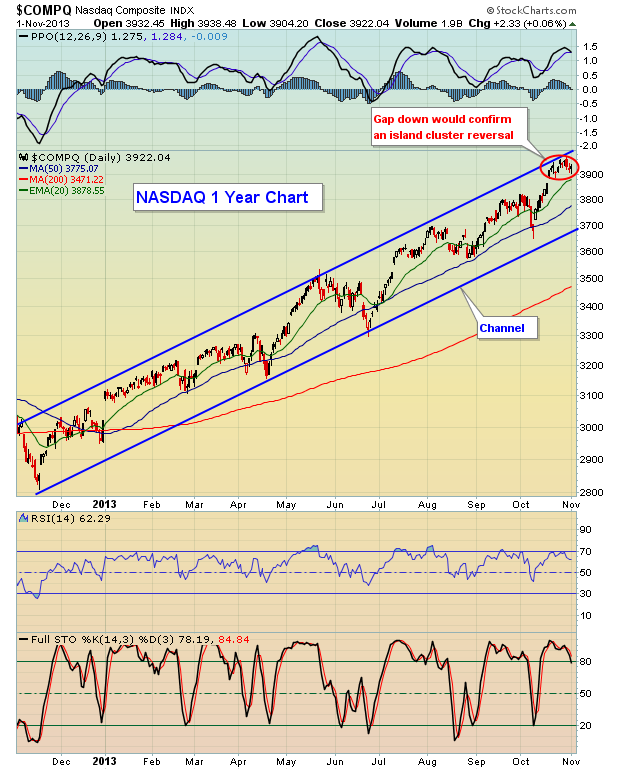
(3) We are stretched on the daily charts with a reversing bearish engulfing candle printing at channel resistance
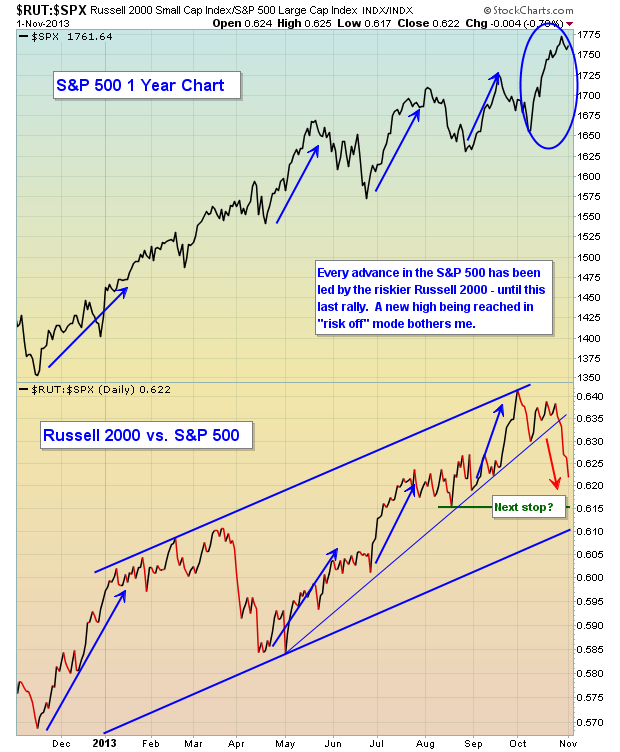
(4) The Russell 2000's relative strength has tumbled over the past two weeks
(5) Copper and crude oil prices - both of which normally correlate positively with the S&P 500 - are not supporting higher equity prices at this time
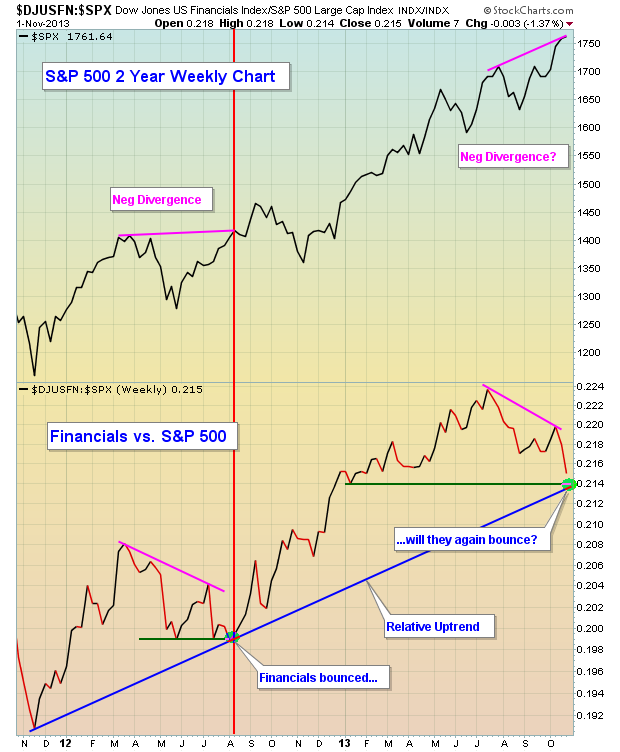
(6) Financials are now falling on an absolute and relative basis
Check out the following charts to support several of these red flags:


I am maintaining my bullish forecast through year end, but I am also keeping one finger on the sell button just in case. If you're long, hedging against your long positions in some fashion probably makes sense. Selling covered calls or buying put insurance are a couple of options.
On Monday, November 4th, I'm hosting the latest in our Online Traders webinar series, "Gap Trading Strategies". If interested in attending, CLICK HERE.
Happy trading!
Tom Bowley
Chief Equities Strategist
Invested Central/EarningsBeats.com
