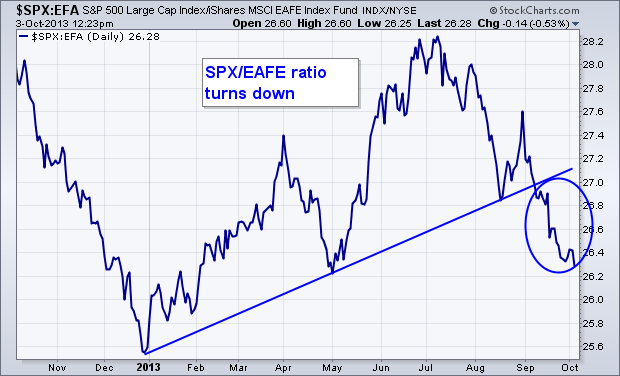
My last message discussed how money was starting to rotate out of an over-extended U.S. stock market into foreign stocks which are trying to catch up to the U.S. market. This message will build on that theme by using ratio (or relative strength analysis). Chart 1 plots a ratio of the S&P 500 versus the EAFE iShares (EFA) over the last year. The EAFE represents developed foreign stocks in Europe, Australasis, and the Far East. After rising between January and June, the U.S./EAFE ratio peaked in July and has fallen since then. [The peak in the ratio coincided with peak in the U.S. dollar and a rally in foreign currencies, especially in Europe]. The ratio has also broken a rising support line drawn under its January/ May lows. That shows that the asset allocation pendulum has swung to foreign developed markets. We see a similar pattern in emerging markets. Chart 2 shows a ratio of the S&P 500 divided by Emerging Market iShares (EEM) having also broken a rising trendline going back to January. That suggests that some money is also rotating from the U.S. into riskier emerging markets.


