I've mentioned it before, but I'll say it again. I LOVE trading stocks (in bull markets) that gap higher on better-than-expected revenues and earnings and very strong volume as it's a sign of great management execution and investor accumulation. That combination is difficult to beat when owning stocks as it's proven to generate not only short-term outperformers, but also long-term winners. I'm more interest in the former though - short-term outperformers. That's what trading is all about - beating the benchmark S&P 500. I'll get back to trading gaps in a moment, but first let's discuss what's going on in the BIG picture.
Last week, the more aggressive NASDAQ and Russell 2000 thumped the S&P 500 and Dow Jones. That NASDAQ gained more than 3% last week, led by a stellar earnings report by Google (GOOG). The Russell 2000's 2.81% was very nice as well, providing this small cap index with its first close above 1100 - EVER. The S&P 500 closed at an all-time high as well. Unless bearish "under the surface" signals begin to emerge, it's difficult (and financially unwise) to bet against a raging bull market. Some of you may be listening to all the negativity on CNBC and other media outlets and wondering how the market can continue to push to all-time highs. STOP listening to the media. They don't care (much) about your financial well-being. They care about RATINGS. Instead of listening to the media, simply listen to the market. It talks to each of us every single day. You just need to understand technical analysis and intermarket relationships to interpret what the market is saying.
There are a few "under the surface" signals that I follow extremely closely. Check out Arthur's article this weekend on the recent relative outperformance of financials. This argues strongly for a continuation of our 4 1/2 year bull market. You want to short this market? Have at it. I won't be tagging along, though. We'll certainly have normal pullbacks from time to time, but I fully expect we'll see further highs during Q4. In addition to Arthur's excellent point about the surging financials, check out these next two charts:
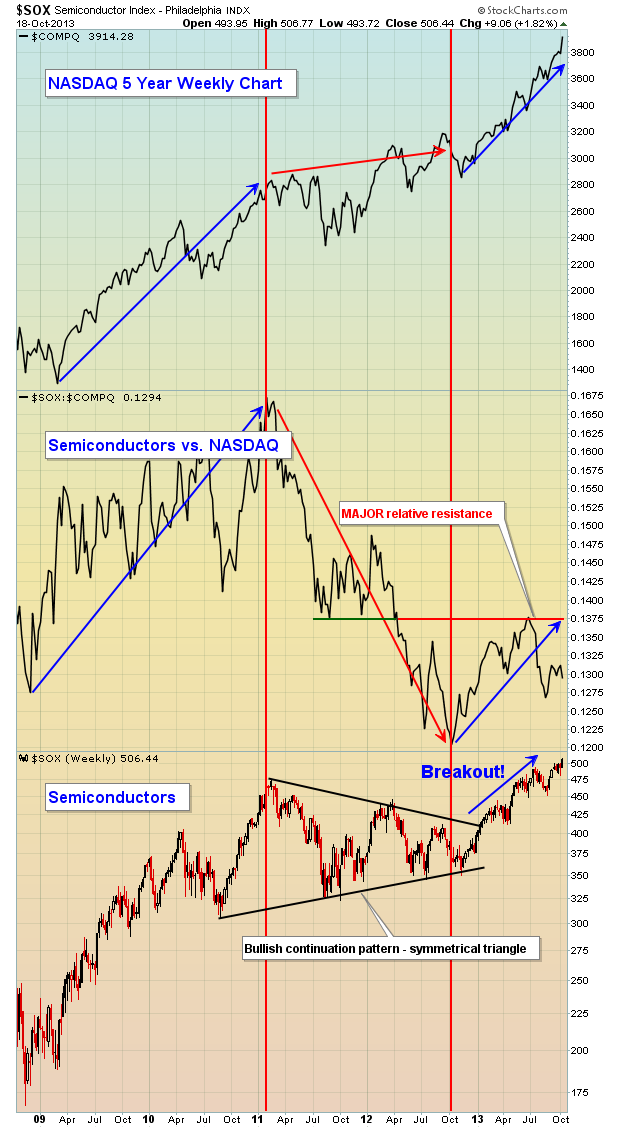
In the case of the SOX chart above, note how well the NASDAQ performs when the relative ratio ($SOX:$COMPQ) is rising. There's a dramatic difference in NASDAQ performance when it's being led by the very aggressive and highly volatile semiconductor industry. During 2011 and 2012, semiconductors performed poorly on a relative basis and that impacted the NASDAQ's results. But note how violently the NASDAQ has moved higher when being led by semiconductors. I believe the two year relative underperformance in the SOX ended in late 2012. Since that time, the SOX has performed quite well on a relative basis. There is a level of relative resistance to watch closely, however. It's at the 0.1375 level (red line on chart). If this MAJOR relative resistance level is cleared, we could continue to see the meteoric rise in the NASDAQ that we've witnessed since October 2012.
The second chart shown is a very simple comparison of consumer discretionary (aggressive) stocks to consumer staples (defensive) stocks. When this ratio rises, it suggests that traders have an appetite for risk. Think "risk on". This type of trader mentality generally results in higher stock market prices, as evidenced by the chart.
So now let's get back to gap trading for a moment. I'm VERY bullish the stock market right now. I've maintained a bullish stance throughout most of this bull market rally and I see not reason to change just yet. This means I am looking at LONG candidates only. I don't short anything in a bull market. What's the point? If you're on the tracks with a train coming right at you, what are your first instincts going to be? I hope they're not to lower your head and run at the train!
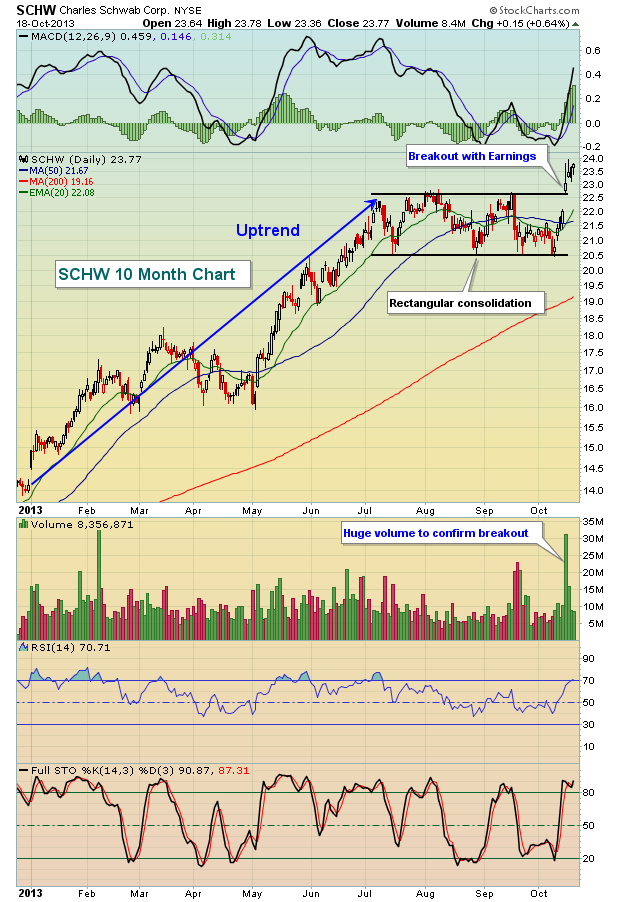
Let's try to further simplify this. If you believe the stock market is going higher, would you rather own companies that just blew the doors off Wall Street estimates in terms of revenues and earnings or would you rather own companies that provide excuses for why they fell short? I hope you don't have to think about this question for very long. Below is an example of a financial company that just reported an excellent quarter. I'm sure most of you have heard of Charles Schwab (SCHW). They reported revenues of $1.37 billion in their latest quarter, ahead of $1.34 billion estimates. Their bottom line earnings beat was $.22 per share vs. $.20 per share. In an era of companies constantly disappointing on top line results, Wall Street responded much the way you'd expect - sending prices higher. Take a look:
Ten days ago, I opened a new service that I'm very excited about - EarningsBeats.com - to coincide with the start of earnings season. EarningsBeats.com focuses exclusively on narrowing down the enormous number of stocks available to trade across all of the major indices to a more manageable list - companies that are executing their business plans to perfection. Every company discussed at EarningsBeats.com will have recently reported better-than-expected revenues AND earnings. In my experience, these are the types of companies that you want to consider trading/owning. Next week is the biggest week for earnings reports as 30-35% of S&P 500 companies will be reporting. I'll be sifting through every one of them, searching for the combination of solid earnings beats and strong technical patterns that we want to feature. If you'd like more information on EarningsBeats.com, simply CLICK HERE.
Happy trading!
Tom Bowley
Chief Equities Strategist
Invested Central/EarningsBeats.com


