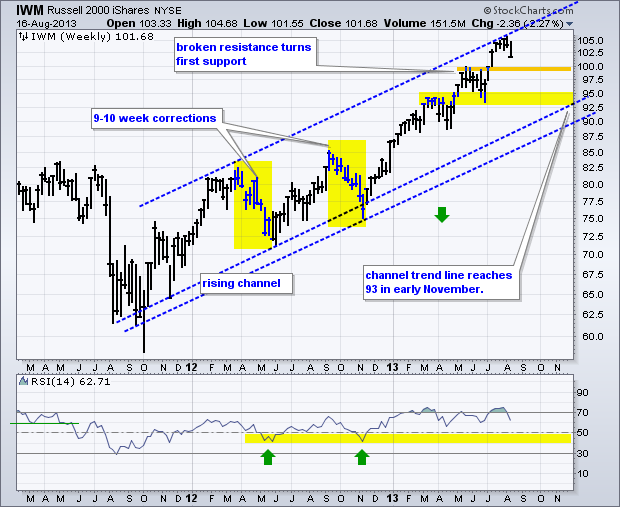
The Russell 2000 ETF (IWM) moved sharply lower this week to start a short-term downtrend, but this is still considered just correction within a bigger uptrend. There are simply no signs of a major top at this moment. Tops often form with major reversal patterns or consolidation, a bearish divergence in the Advance-Decline Line or relative weakness in the key offensive sectors. These factors were not present when the market peaked in early August. A correction at this point is hardly surprising given the run up from mid November to early August. The Russell 2000 ETF surged some 40% from the November low to the August high, while the S&P 500 ETF (SPY) and Nasdaq 100 ETF (QQQ) advanced over 25%. These are huge moves that deserve a rest, which is what a correction implies.

Click this image for a live chart.
The chart above shows IWM within a rising channel the last two years. The ETF hit the upper trend line in late July, stalled for a few weeks and fell back below 102 this week. At this point, chartists can start contemplating correction targets and timeframes. Short corrections last a few weeks. The last two "long" corrections lasted 9-10 weeks. A 10 week correction would extend into mid October. For price levels, broken resistance in the 99-100 area turns first support for a short correction. Broken resistance, the June lows and the lower trend line mark key support in the 93-95 area. Note that the lower trend line does not reach this area until November. Chartists can also use RSI to set a support zone because it usually trades between 40 and 80 during an uptrend. Notice how this momentum oscillator bounced off the 40-50 zone in May and November 2012. RSI has yet to breach 50 in 2013, which is testament to the strength of the current uptrend. Chartists can mark RSI support in the 40-50 zone and look for IWM to firm if/when RSI reaches this zone.
Good weekend and good charting!
--Arthur Hill CMT

About the author:
Arthur Hill, CMT, is the Chief Technical Strategist at TrendInvestorPro.com. Focusing predominantly on US equities and ETFs, his systematic approach of identifying trend, finding signals within the trend, and setting key price levels has made him an esteemed market technician. Arthur has written articles for numerous financial publications including Barrons and Stocks & Commodities Magazine. In addition to his Chartered Market Technician (CMT) designation, he holds an MBA from the Cass Business School at City University in London.
Learn More