Hello Fellow ChartWatchers!
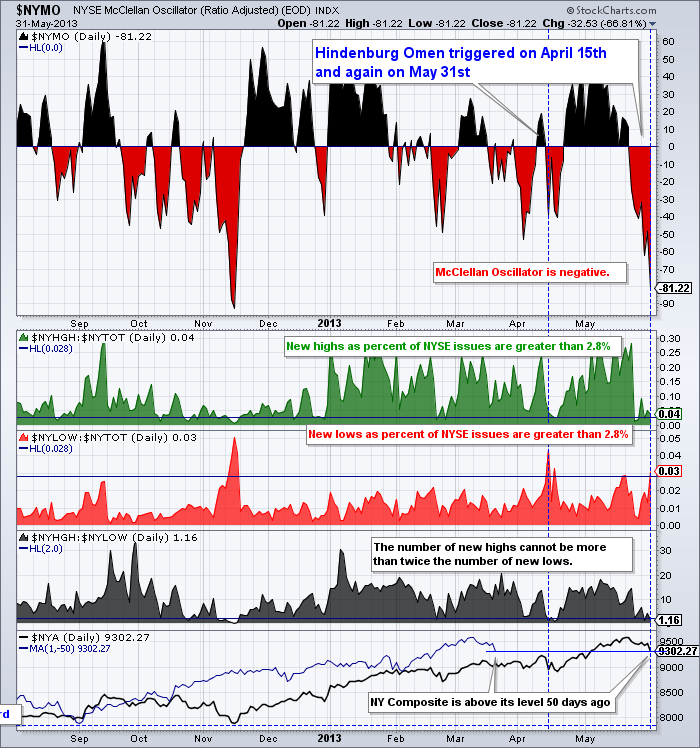
It happened in mid-April and it happend again on the last day of May. The ominous sounding "Hindenburg Omen" signal has been given. Here's the chart:

StockCharts members can click here for a live version of this chart.
Here's the definition from our ChartSchool Glossary page:
"Hindenburg Omen: Created by James Miekka, the Hindenburg Omen warns of potential weakness in the stock market. There are three criteria to activate the omen. First, NYSE new highs and new lows must both be more than 2.8% of advances plus declines. Second, the NY Composite is above the level it was 50 days ago. Third, the number of new highs cannot be more than double the number of new lows. The activation period is good for 30 days. Once active, a sell signal is triggered when the McClellan Oscillator moves below zero and negated when the McClellan Oscillator moves back above zero."
So Friday's big drop triggered the Omen signal by causing $NYLOW:$NYTOT (the ratio of NYSE Lows to NYSE Total Stocks) to spike up above 2.8% (the red area graph above).
Given that this is the second time in two months that this signal has occured, ChartWatchers would be well advised to look for additional signs of technical weakness in this market. The rest of this newsletter, unfortunately, has several.
Take care everyone,
- Chip
P.S. I'm really looking forward to seeing everyone next week at the SCU Seminar in Seattle. This will be the first time we present the SCU 102 course that focuses on how to customize your account's settings and ChartLists. There are still a few seats available if you have time to join us.
