Hello Fellow ChartWatchers!
StockCharts continues to grow and expand, providing more value for its users (hey! that's you!) for free. Here are three great improvements we rolled out last week:
1.) Stocks & Commodities Articles for StockCharts Members
Our "Search" feature now automatically includes results from the complete archives of Stocks & Commodities magazine. Members can click on any of those results to see a PDF version of the article in question. Some of these go back as far as 1982!
In addition, members can now click on the "Stocks & Commodities" link on the right side of the "Members" page for free access to the current editions of S&C as well as the companion magazine Working Money.
And soon, watch for relevant S&C links to be included at the bottom of our ChartSchool articles!
Thanks again to Jason Hutson and his crew for making this happen. S&C has been an amazing resource for the technical analysis community for decades and we are thrilled to have this new partnership.
2.) Economic Indicators Added -
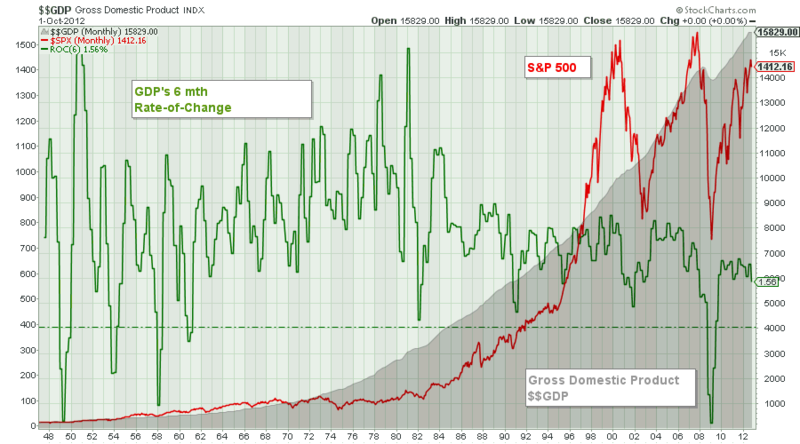
We've started rolling out the first of many economic indicators on our website. These new symbols all start with two dollar signs ($$). Most are monthly datasets from the FRED website. Here's an example that uses the new $$GDP symbol (the gray area plot):

(Click the chart for a larger version. PRO users click here for a live version.)
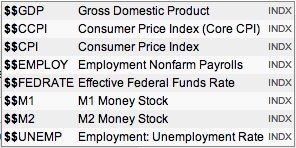
To see the complete list of the economic datasets we currently have, just type "$$" into the "Create a Chart" box at the top of any of our pages. Here's the current list (but keep in mind it will be expanding over the next couple of days and weeks):
3.) Extra Members Can Now Create and Chart Their Own Personal Data -
Last year we rolled out our User-Defined Index feature to our PRO subscribers. We've now made a limited form of UDIs available to all Extra and ExtraRT members. Those members can now create and use a single UDI called "@MYINDEX" by clicking on the new "User-Defined Index Workbench" link on the "Members" homepage.
A User-Defined Index allows you to upload and chart data from a spreadsheet. The data can contain any time-series information you want. It is a really powerful feature. Here are some articles that illustrate how it can be used.
4.) Bonus Improvement #4 - More Speed!
As I mentioned last time, we are continuing to upgrade our datacenter and the new servers are making a noticable improvement in the time it takes to generate charts during market hours. Check out these charts from our independent monitoring service Pingdom:
The top chart shows the average time it took for us to generate charts during March. The bottom charts shows the times during the first days of April. See the nice drop on March 30th and 31st? It represents a roughly 20% improvement in the time it takes for us to send out a SharpChart! That improvement has continued in April as well. (Click here to see for yourself.) And we're not done yet - hopefully we can squeeze out even more speed soon.
Do you want even more improvements? Trust me, we're working on some doozeys. Just stay tuned!
- Chip
P.S. If you are feeling overwhelmed by the sheer number of features StockCharts offers, why not join me for a personal tour of everything we have to offer? I'm personally giving our SCU 101 seminar in several locations throughout the country this year including Long Beach, Seattle, Toronto, New York and Dallas. Click here for more info. I hope to see you at one of these events soon!
P.P.S. Oh yeah, one more thing... Have you picked up your copy of Arthur Hill's first book? What? You didn't know Arthur Hill published a book? OK, that's my fault for not making a bigger deal of it. But now that you know, why not take advantage of our 50% special on Art's book? He'd really appreciate it! Just click here for details.


