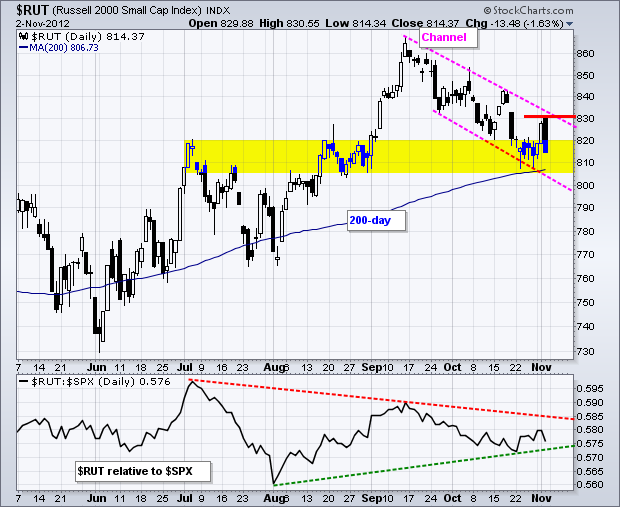
Stocks surged on Thursday and even followed through on Friday morning, but strength did not last long as selling pressure kicked in after the initial pop. Perhaps some pre-election jitters produced this classic pop and drop. Whatever the case, the Russell 2000 hit stiff resistance near its channel trend line and remains in a short-term downtrend. The chart below shows the index zigzagging lower since mid September. $RUT found support at the 200-day moving average and the late August consolidation (yellow area). Thursday's surge off support was impressive, but follow through is what separates one-hit wonders from trend reversals. A follow through breakout is needed to reverse this seven-week slide and signal a continuation of the bigger uptrend, which has been in place since early June.

Click this image for a live chart.
The indicator window shows the $RUT:$SPX ratio triangulating the last four months. A potential higher low could be forming in October, but we need to see a breakout to signal relative strength in the Russell 2000 (small-caps). This would be positive for the overall market. Note, however, that a break below the October low would signal renewed relative weakness in small-caps.
Good trading and good weekend!
Arthur Hill CMT
