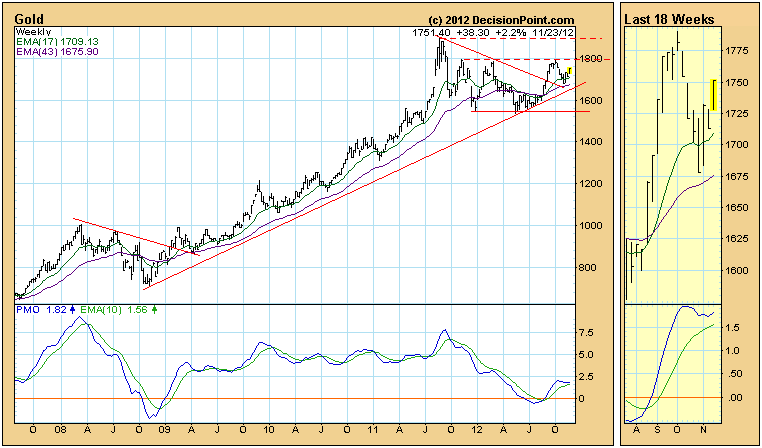
On the weekly chart below, we can see that, after making a new, all-time high back in August of 2011, gold went into a correction/consolidation mode, ultimately forming a descending triangle. While this formation suggests lower prices (the flat line is the weakest), price broke up through the top of the triangle. After a breakout the technical expectation is for price to pull back toward the line, which it did enthusiastically.
After testing that support, price has reversed upward, and this week made a strong move upward, signalling that the rally that began this summer is probably resuming. The weekly PMO (Price Momentum Oscillator) turned up again, which is a very positive sign.
Conclusion: Gold has completed its post-breakout pullback and appears to be resuming its long-term advance, but this will not be "official" until the October top is exceeded. It needs to overcome resistance in the area of 1800, and finally the resistance at the all-time high around 1900.

