Weakness in the technology sector has been offset by strength in the finance sector since early September. This is why the S&P 500 is range bound the last five weeks and the Nasdaq is in a downtrend. With these two sectors cancelling each other out, chartists must turn to another sector to break the deadlock. My vote goes to the consumer discretionary sector because it is the most economically sensitive sector. One could also consider the industrials sector because it supplies companies with capital-intensive goods and services needed for their operations. Both sectors are clearly important to the economy and the broader market.

Click this image for a live chart.
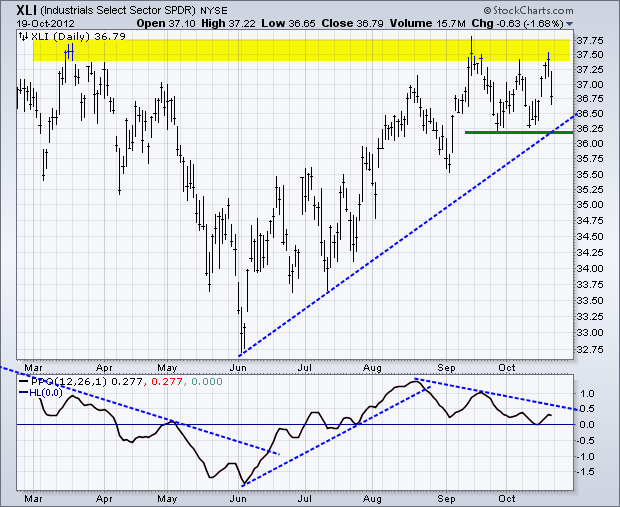
The first chart shows the Industrials SPDR (XLI) in an uptrend since June. Even though XLI did not take out its spring high, it has yet to break consolidation support. XLI established support with the last two troughs and the June trend line. Look for a break below this level to reverse the uptrend. The indicator window shows the Percent Price Oscillator (PPO) moving lower the last two months, but remaining in positive territory. The trend line breaks act as early warning signals. Note, however, that it takes a centerline cross (zero) to fully reverse momentum.

Click this image for a live chart.
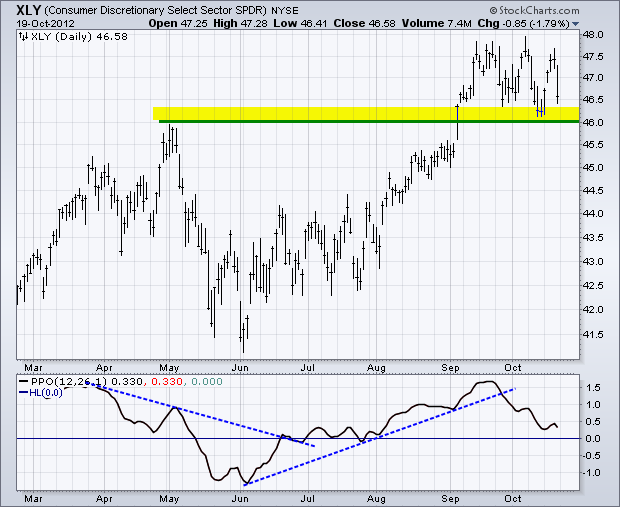
The second chart shows the Consumer Discretionary SPDR (XLY) breaking resistance from the May high and broken resistance turning into support the last few weeks. XLY declined sharply two weeks ago, but ultimately held support and bounced early last week. The ETF declined sharply on Friday to set up another important support test at 46. The indicator window shows the PPO breaking its June trend line and moving lower the last few weeks. Breakdowns in both XLI and XLY would be bearish for the broader market.
Good trading and good charting!
Arthur Hill CMT
