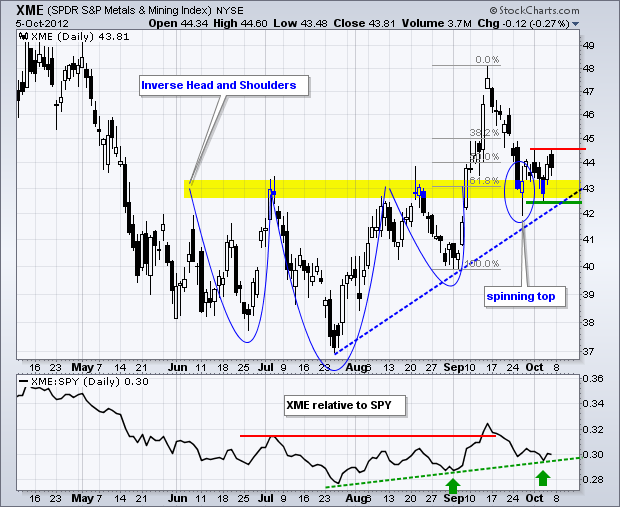
The Metals & Mining SPDR (XME) is battling to hold its resistance breakout. XME broke resistance with a big surge in early September and broken resistance turns into first support in the 43 area. This is a classic tenet of technical analysis: broken resistance turns support. A spinning top formed at the end of September and the ETF consolidated the next seven trading days. Monday's high marks short-term resistance and a close above this level would be bullish. This would reinforce support in the 43 area and increase the chances of a continuation higher.

Click this image for a live chart.
Also note that there is a possible inverse head-and-shoulders pattern extending from June to early September. XME broke neckline resistance and the September decline is a throwback to broken resistance. The breakout is being tested with this throwback and a break below last week's low would be a bearish development. The indicator window shows the price relative trying to form another higher low in early October. A break below this trendline would signal a return to relative weakness.
Good day and good charting! ~Arthur Hill CMT
