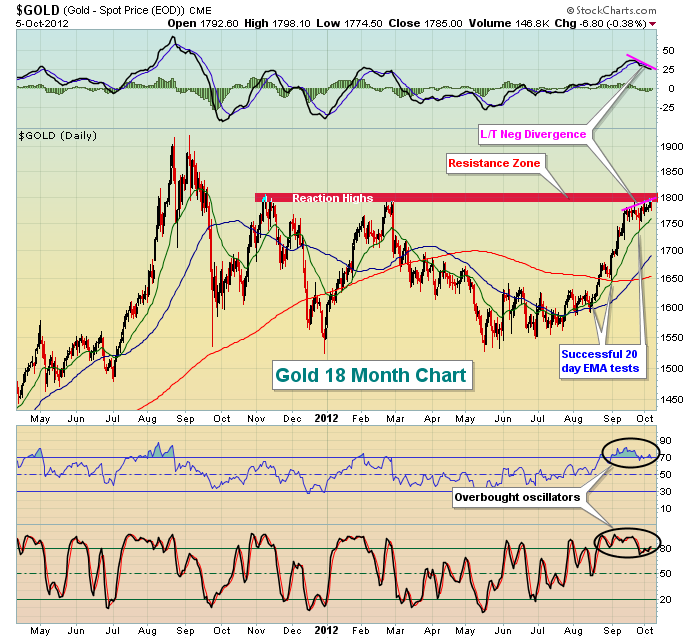
To be honest, I'm not a big fan of providing outlooks too far into the future because prices change continually. As a technician, I realize charts can change daily. Therefore, I have to be willing to change my thinking on a dime and, if you're managing your own money, you should too. But I do like to evaluate the likelihood that a trend, either up or down, is sustainable. With that in mind, let's take a look at gold. A little over a month ago, I wrote about the "gold rush" being on. Since that time, gold has risen another $100 per ounce, or roughly 6%. I remain bullish on gold for the intermediate-term - perhaps 3 to 6 months - but short-term gold now has a few technical issues to deal with. Take a look:

First, gold is definitely overbought, so a near-term unwinding of both the RSI and stochastic is to be expected. Second, a fairly significant area of price resistance has been reached. The reaction highs in November 2011 and February 2012 both failed between $1790 and $1810 an ounce. We saw three intraday highs last week in the $1790s. Finally, traders need to deal with slowing momentum. Take a look at the chart above and check out the lower MACD reading with the higher price action. That long-term negative divergence does NOT guarantee a pullback in price, but it does indicate the RISK of a pullback has increased. The fact that this slowing momentum is occurring simultaneously with price resistance makes it difficult to take any further long position in gold until one of two things happens. I either want to see (1) a 50 day SMA test and a MACD centerline test to "reset" this momentum oscillator, or (2) I want to see the breakout above price resistance. I'm not going to assume gold will rally right through resistance, especially when technicals are telling me that upside momentum is slowing.
On Monday, October 8th at 4:30pm EST, I will be hosting Invested Central's "State of the Market" online webinar where I'll discuss the fourth quarter prospects of gold and equities in general. This webinar is reserved for annual members of Invested Central, but we always provide new annual members a 7 day, no-questions-asked Money Back Guarantee. So if you'd like to attend this event, CLICK HERE for further details.
Happy trading and Happy Thanksgiving Canada!
Thomas J. Bowley
Chief Market Strategist
Invested Central

About the author:
Tom Bowley is the Chief Market Strategist of EarningsBeats.com, a company providing a research and educational platform for both investment professionals and individual investors. Tom writes a comprehensive Daily Market Report (DMR), providing guidance to EB.com members every day that the stock market is open. Tom has contributed technical expertise here at StockCharts.com since 2006 and has a fundamental background in public accounting as well, blending a unique skill set to approach the U.S. stock market.
Learn More