Hello Fellow ChartWatchers!
Last month we added a feature that many of you have been asking for for a long time - custom technical alerts! Today I want to spend some time showing you how they work and one of the best ways they can be used to help you make better investing decisions.
First off, let's review the typical process for investing with technical analysis:
- Use custom technical scans to search for stocks that have a chart setup that you are interested in trading.
- Use SharpCharts with your custom indicator settings to find the best scan result(s) and determine entry point and exit conditions.
- Enter the position.
- Monitor the stock for technical warning signs and/or sell signals.
- Close the position when sell signal given.
OK, so StockCharts Extra and PRO members have always had the tools to perform tasks #1 and #2. Tasks #3 and #5 are done via your trading platform. Which leaves us with task #4 - monitoring your open positions for technical warning signs and/or sell signals.
Our new Custom Technical Alert feature is intended to automate much of that task.
A technical alert is a set of technical criteria which you create (just like our Advanced Scans) that we then continually evaluate while the market is open. If the alert's criteria ever becomes true, we send you an email notifying you of that event.
So, imagine that you are a technical trader who thinks that the Parabolic SAR gives a great set of signals for tech stocks in the S&P 500. (This is a simple example for the sake of this article - real trading signals are often more complex.) Whenever you are out of the market, you are using your trusty Parabolic SAR scan to find opportunities to get back in. Here's what that scan might look like:
[group is SP500] and [group is TechnologySector] and [Today's Low x Parabolic SAR(0.02,0.2) ]
This scan finds all large-cap technology stocks that just had the dot for today's Parabolic SAR move below today's price bar - the standard (simple) Parabolic SAR signal. (Remember, the "x" in the middle means "crosses above" in our scan system.) When I run that scan for today (Sept. 1st, 2012) I get 5 results: CERN, GLW, LLTC, MSFT, and SAI.
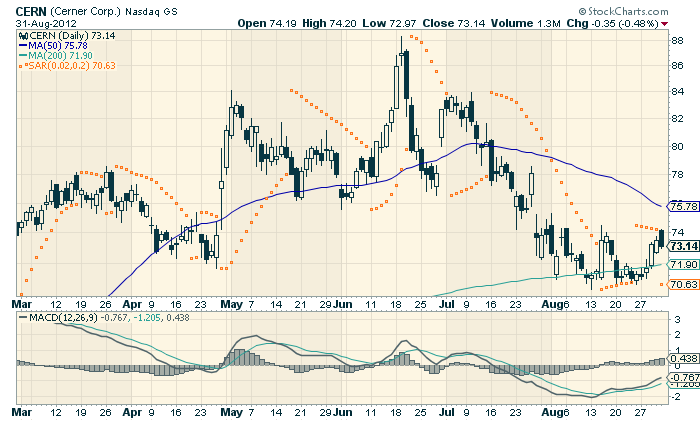
For Task #2, you'd use our SharpCharts charting workbench to examine each of those 5 stocks in greater detail. For the purposes of this article, let's say that after you studied all 5, you decided you really liked the chart for CERN:

Click here for live version of this chart.
So, you then do some more analysis with that chart to determine your entry strategy, your stop locations and your exit strategy. (Dr. Elder's eBook in our bookstore is a great place to learn more about this part of the process.) You then - task #3 - place an order with your broker to buy the stock.
Terrific! All finished. Right?
No. Now, with custom technical alerts, you can finally automate task #4 - the monitoring process.
For our example, let's assume that you plan on holding CERN until the Parabolic SAR gives a sell signal (which happens when the dots first move back above the price bars). In other words, you want to be notified when the following condition is true:
[symbol = 'CERN'] and [Parabolic SAR(0.02,0.2) x Today's High]
The first part of this alert expression ties our alert to the only stock we are interested in monitoring, CERN. The second part of this alert expression is essentially the opposite of the scan expression that you used to find the stock during task #1 above. It will be true when the Parabolic SAR's dots move back above the price bars - which is our sell signal.
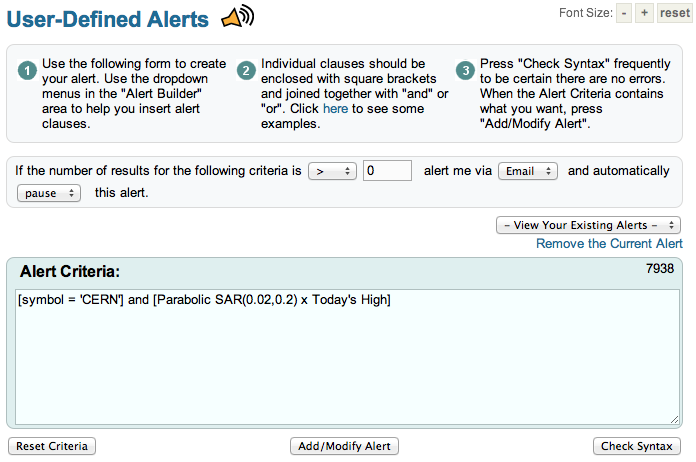
To enter that alert into StockCharts, Extra and PRO members can login and use the new "Technical Alert Workbench" via the link on the "Members" page:
Simply enter your criteria and then click "Add/Modify Alert" to add the new alert to our system. You'll want to give your alert a name that matches what it looks for - something like "CERN Parabolic Sell Signal" in this case.
That's it! Once an alert has been added, we will continuously run the alert until its expression(s) become true. In this case, we will run the alert until the expression returns more than zero results. Once that happens, we will send you an email automatically.
Pretty neat huh?
There are some things to keep in mind when using our technical alerts:
- Extra and ExtraRT members can have up to 5 custom alerts saved in our system at any one time. PRO members can have up to 50.
- Just like our custom technical scans, our alerts are based on daily data bars. That means that you need to express your alert in terms of the technical conditions that happen on a daily chart.
- Because our alerts are based on daily data, they can only be triggered once per day. When a signal appears on a daily chart, we will alert you at that point. If, later in the same day, the signal disappears and then reappears a second time, we will not alert you about that second occurance.
- Alerts are typically associated with one ticker symbol (as shown in the example above). If you create an alert that applies to multiple ticker symbols, the alert email is not able to show you which ticker symbol(s) triggered the alert. In that case, you would need to re-run your alert criteria as an Advanced Scan to see those results.
- Unlike scans, saved alerts are continually evaluated by our servers. All saved alerts are re-evaluated at least once every minute the market is open. This makes it important that you pause/delete alerts that you are no longer interested in.
- We also publish many Predefined Alerts on this page. Predefined Alerts also generate Twitter messages with the hashtag #sccalerts when they occur.
The scenario I described above is the "standard" scenario for which we designed our technical alerts feature. That said, there are a couple of other very interesting ways this new feature can be used. Check out my blog over the next week or so for more examples and ideas on using custom technical alerts.
- Chip

