Hello Fellow ChartWatchers!
The Fed spoke and the markets took off. StockCharts.com was one of the best places to watch as stocks surged in the wake of the Fed's QE3 announcement. You can read more about how it affected things from the rest of the columnists in this week's newsletter. As for myself, I'm going to talk about how you can now create and chart your own personal Bullish Percent Index with StockCharts.com.
MY OWN "SMALL CAP" BPI
In case you haven't heard, Bullish Percent Indexes are one of the best ways to measure the strength of a group of stocks. A BPI is a daily market indicator that shows the percentage of stocks in a group that have bullish looking Point & Figure charts. To compute a BPI, each day you count up the number of stocks in your group that currently have the "P&F Buy Signal" pattern on their P&F chart. You then divide that number by the total number of stocks in your group and multiply by 100 to get the BPI value for the day. After gathering these values for many days, you can then chart the results to get a sense of how strong the group has been over time.
We here at StockCharts have been automatically calculating 19 different BPI's every day including $BPNYA (the BPI for all NYSE stocks), $BPCOMPQ (all Nasdaq stocks), $BPTSE (all Toronto stocks), and many others.
But what if you want to chart a BPI for a group of stocks that we don't cover? Now, with the User Defined Index (UDI) feature of our PRO service, you can!
You start by creating a group of stocks that you want to use for your BPI. You can choose from some of our predefined stock groups or you can create a ChartList in your account, add whatever symbols you want, and use that as your group. For the sake of this example, I'm going to use the 600 stocks in the S&P Small Cap index to create my own "Small Cap" BPI.
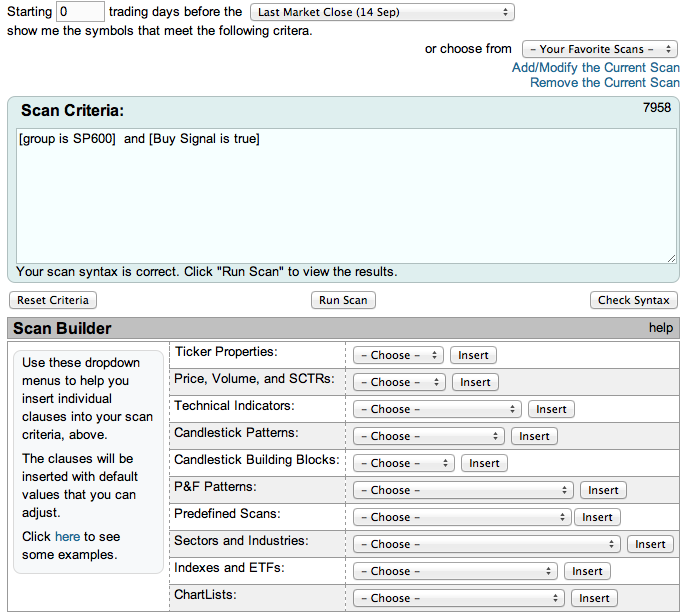
Once you have a group in mind, you can use our Advanced Scan Engine Workbench to create a scan that shows you how many stocks in your group have a P&F Buy Signal. Your scan should have two clauses, one for your group / ChartList, and one for the P&F Buy Signal. Here's an example:
You can use the "Sector and Industries" dropdown, the "Indexes and ETFs" dropdown, or the "ChartLists" dropdown to help you create the first clause in the scan. You then use the "P&F Patterns" dropdown to add the "P&F Buy Signal" clause to the end of the scan.
Now, make sure that you have a zero in the "Starting" box at the top of the scan page and that "Last Market Close" is selected from the top dropdown, then press the "Run Scan" button. You should then see a page full of scan results. For the BPI calculation, you only need to see the "Count" of the scan results - i.e., the number of stocks that was returned. In the case of the scan I showed you above, the count is 412.
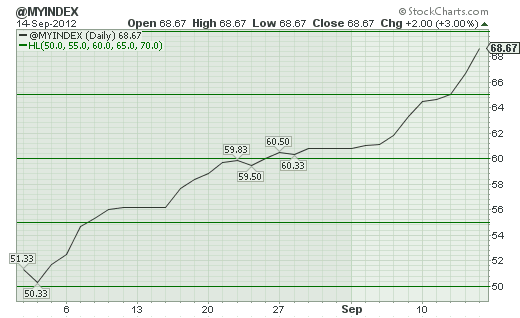
To calculate the BPI value for today, you take that count and divide it by the total number of stocks in your group, then multiply it by 100. In my example, Friday's BPI value turns out to be 68.67.
For safety sake, I recommend that you write down that value and the date that it corresponds to (Sept 14th in this example) on a sheet of paper in order to make sure your work isn't lost. Later, we'll enter that information into your User-Defined Index area.
Now, knowing today's BPI number is useful, but we'd love to see a chart of recent BPI data for our group in order to see if any trends exist. To "back-calculate" BPI values for previous days, we simply change the number in our scan's "Starting" box, re-run the scan, and recompute the BPI value for that day.
Note - It's important to record the calendar date for each BPI value you calculate. It make that easier, you can use the popup calendar that automatically appears when you click inside the "Starting" box.
Continuing our example, when I change the "Starting" box to "1" and re-run the scan, I get 400 results. So I record 400/600 = 66.67% as the value for Sept. 13th, 2012. I get 390 stocks for Sept. 12th, 388 for the 11th, 387 for the 10th, and 380 for the 7th.
Feel free to go back as far in time as you'd like but keep one thing in mind - if your group is a sector or index that changes its membership over time, the further back in time you go, the less accurate your "back-calculated" BPIs will be because you will still be using the current group membership.
Once you have a nice amount of BPI values written down, it's time to enter then into your User-Defined Index (UDI) symbol (typically called @MYINDEX) so that you can chart them.
To enter your data into @MYINDEX, go to the "Members" page and click on the link for the "User Defined Index Workbench." Once there, click on "Delete All Data" to get rid of any previous data you had in @MYINDEX and then start entering the BPI dates and values that you wrote down in the previous step.
Note: You only need to enter the date in the "Date" field and the BPI value in the "Close" field. Leave the other field blank and hit "Add Row." We'll automatically fill in the other rows.
After your data is entered, press the "View Chart" link to see the results. For our "Small Cap BPI" example, here's what I got after back-calculating date back to the start of August:
So this shows that the small-caps have strengthened significantly since August 1st confirming similar strength seen in charts of $SML and $RUT.
The larger point here is that PRO members can create and chart BPIs for any collection of stocks they find interesting using these techniques. The even larger point is that PRO members can create and chart any index they want, not just BPIs.
- Chip
Have you used our User Defined Indexes to create a new / unusual / unexpected kind of chart? If so, let us know about it and we may feature your work in a future article.


