Any time the S&P 500 moves to fresh new highs, I try to determine the likelihood that the move is a sustainable one. Traders need to be in the right mindset to carry prices further. They need to be aggressive in terms of where they place their trading dollars. If sector leadership comes from financials, technology, industrials and consumer discretionary, it's a sign that it's a risk-on environment, which generally is quite bullish. But as we saw in May 2011, it's never a good sign to break out with defensive areas of the market leading the way. In my opinion, market participants are not "committed" if they're only willing to invest in defensive groups.
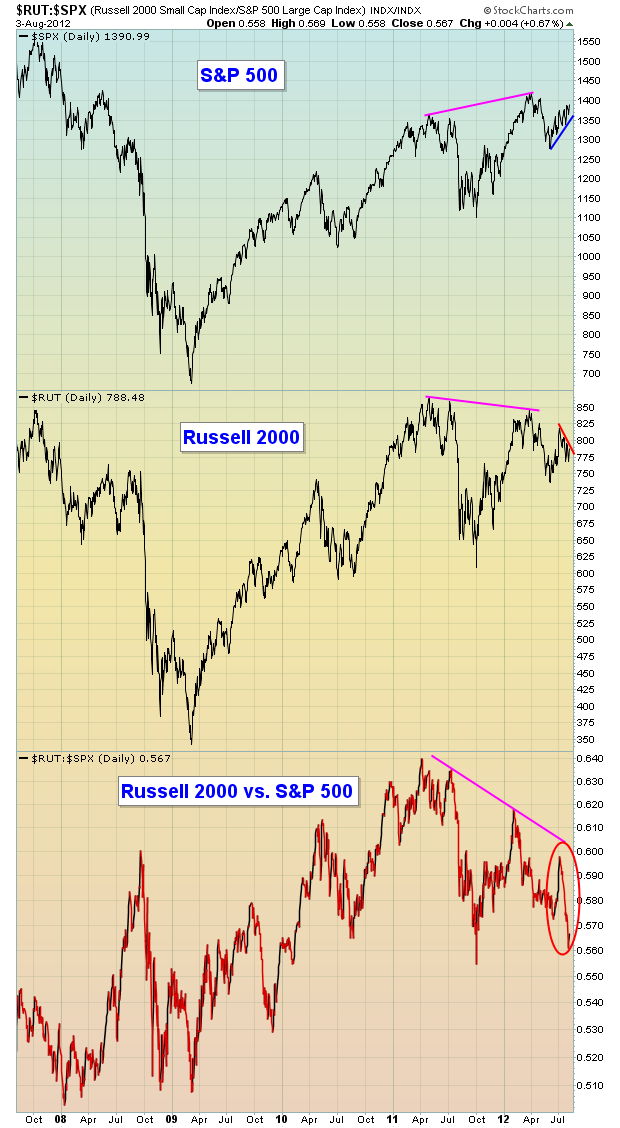
The Russell 2000 is one of the more aggressive areas of equities to invest in. Take a look at how this group is lagging on an absolute and relative basis:
From a longer-term perspective, you can see the S&P 500 broke out in the first quarter of 2012 above the 2011 highs, but note the Russell 2000 never made that same breakout. Therefore, the bottom chart shows the relative performance of the Russell 2000 to be abysmal. On a shorter-term basis, the S&P 500 and Russell 2000 are going in nearly opposite directions with the S&P 500 climbing and the Russell 2000 weakening. What gives?
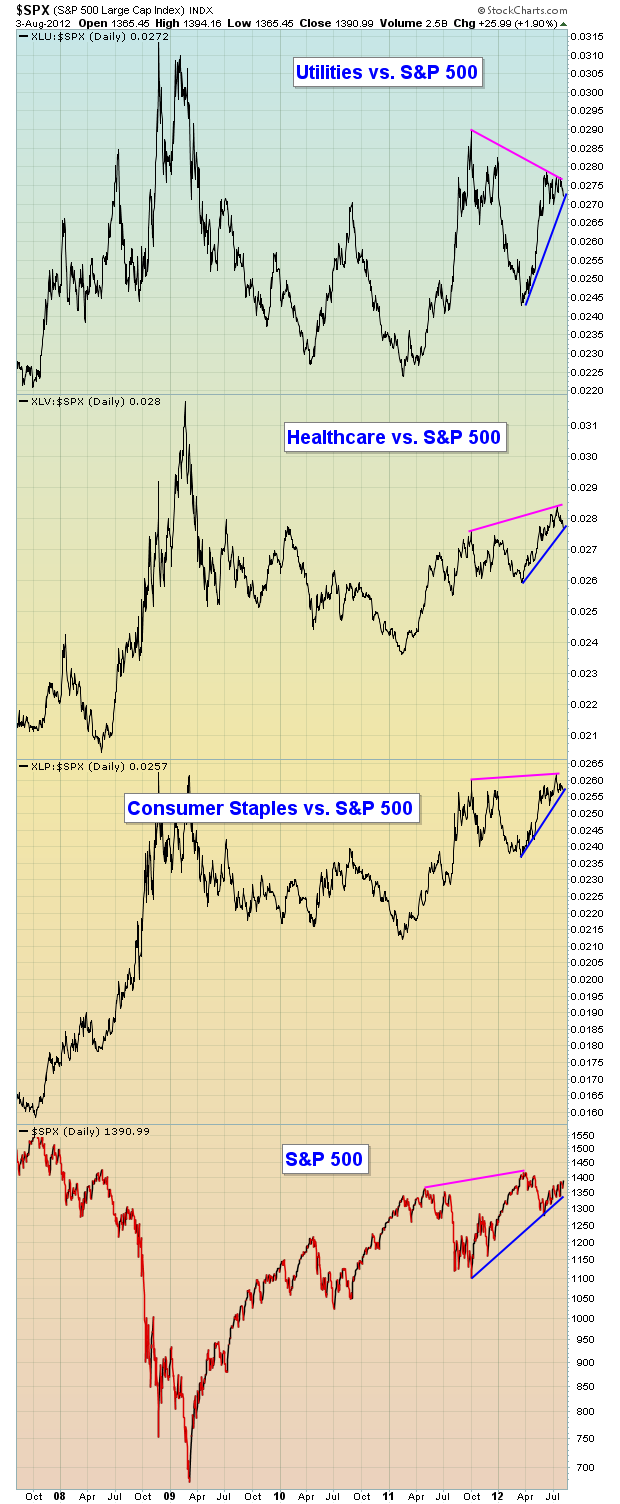
The other problem is that defensive groups are leading this rally to the upside on the S&P 500. The last time we saw this scenario in April/May 2011, it preceded a significant drop in our major indices. Check out this chart:
It's very unusual to see the relative strength of defensive sectors moving in the same direction as the S&P 500. If you study a chart like this over time, you'll see there is almost always a direct NEGATIVE correlation between the two. When they're both rising, we MUST take note. Will this again mark a top? It's hard to say. I remain bullish and believe we'll see another leg higher into the end of 2012 or early 2013, but short-term it's dicey with this type of relative leadership, especially since we're in the historically weak August-September period. Stay on your toes!
Listen, even in uncertain markets like the one we're in now, there are trading opportunities. We just need to make sure we monitor the reward to risk on every trade and keep our stops in place to minimize losses. One nice reward to risk trade (long-term positive divergence) to consider is featured as our Chart of the Day for Monday, August 6th. CLICK HERE for more details.
Happy trading!


