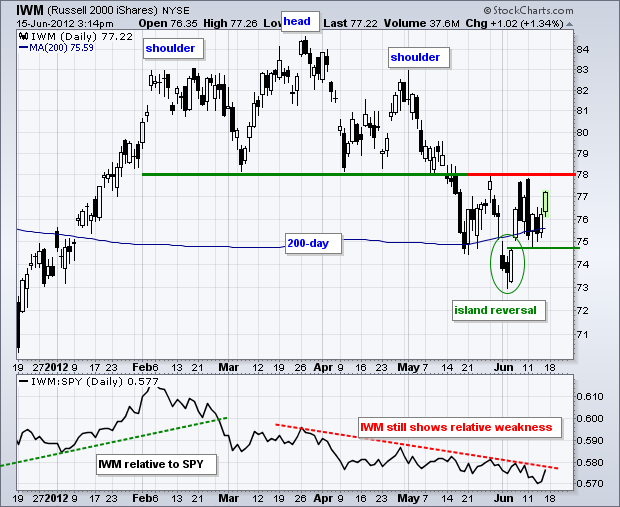
The Russell 2000 ETF (IWM) got a bounce at the end of the week, but remains in a trading range since the June 6th gap. There are two dynamics at work on this chart. First, the medium-term trend is down after the ETF broke neckline support from a head-and-shoulders pattern. Broken support turned into resistance, which held in late May and early June. A convincing break back above this level is needed to negate the head-and-shoulders breakdown.

Click this image for a live chart.
The second dynamic is the short-term uptrend. This is a counter-trend bounce with a bigger downtrend. IWM formed an island reversal in early June with a gap and move back above the 200-day SMA. This gap is holding as the ETF consolidates with a volatile trading range. Notice how IWM crossed the 76 level at least five times in the last eight days. The gap is still holding and this week's low marks support. A break below this low would signal a failed gap and a continuation of the medium-term downtrend. Of note, the indicator window shows the Price Relative (IWM:SPY ratio) hitting a new 2012 low this week. Small-caps are underperforming and this is a negative for the market overall.
Good trading!
Arthur Hill CMT
