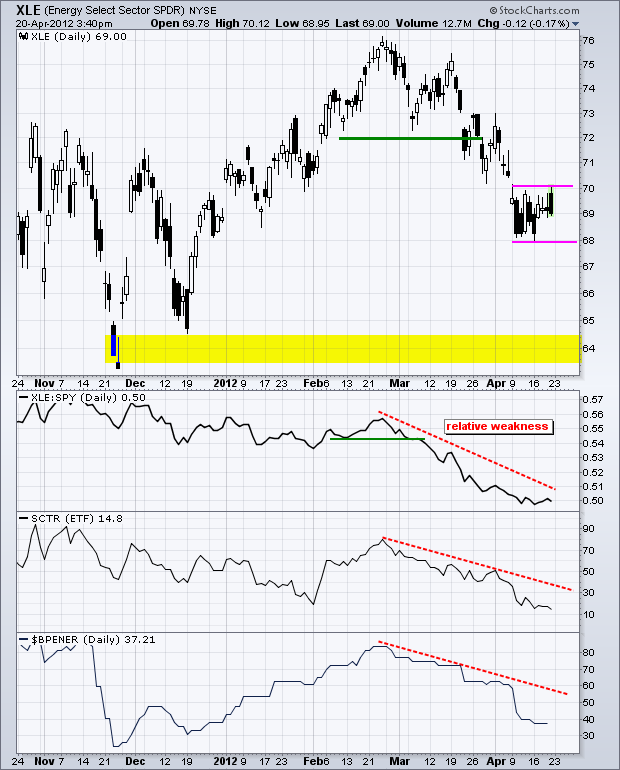
The Energy SPDR (XLE) broke key support in late March with a sharp decline and has yet to reach the next key support level. The chart below shows XLE consolidating in the 69 area over the last two weeks. This consolidation looks like a rest within the downtrend. A break below 68 would signal a continuation lower and target further weakness towards the next support zone in the 64 area. Support here stems from the lows in late November and mid December.

Click this image for a live chart.
Three indicators confirm relative weakness in XLE. The price relative, XLE:SPY ratio, has been trending lower the last six months and the decline accelerated since late February. The StockCharts Technical Rank (SCTR) also peaked in late February and moved sharply lower. Notice that the SCTR is trading below 20, which makes it the lowest of the nine sector SPDRs. The last indicator window shows the Bullish Percent Index moving below 40 this month, which is also the lowest of the nine sector SPDRs. This means that fewer than 40% of the components are on PnF buy signals. Put another way, more than 60% of the components are on PnF sell signals.
