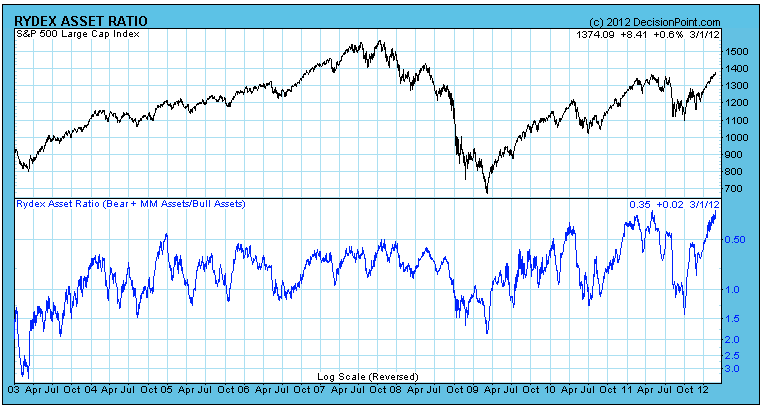
At Decision Point we keep a close watch on asset levels in the Rydex mutual fund group as a way of evaluating investor sentiment. An important result of these efforts is the Rydex Asset Ratio, which is calculated by dividing assets in the Bear plus Money Market Funds by the assets in the Bull Funds.
On the chart below we can see that the Ratio has reached the highest level in 10 years, which shows an unusually high level of bullishness on the part of Rydex investors. Based on previous Ratio tops shown, we can assume that prices are likely to correct or consolidate at the very least.
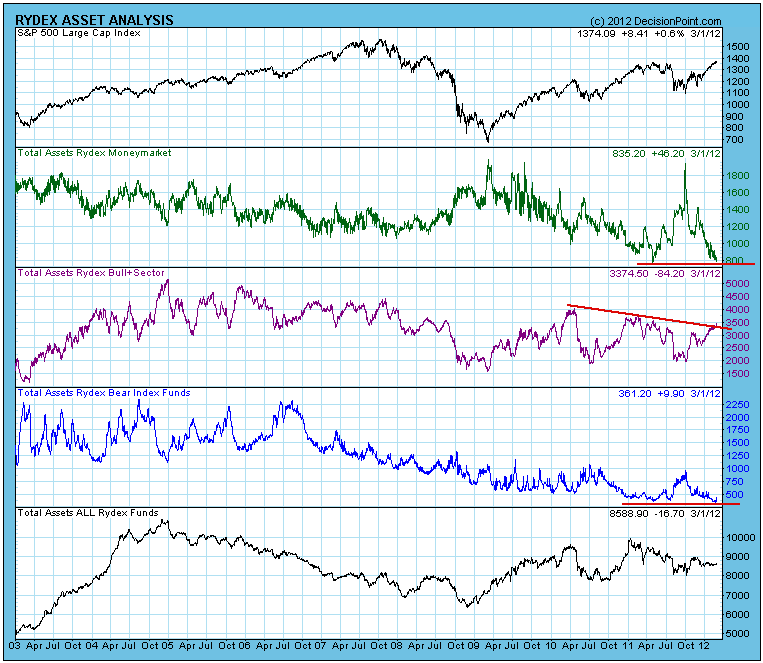
Digging deeper into the numbers, the following chart shows that Money Market Assets are near 10-year lows, which indicates that Rydex investors have very little money on the sidelines with which to make an additional commitment to bullish positions. Also, Bear Fund Assets are near 10-year lows, demonstrating that Rydex investor expectations for bearish outcomes is very low. These bullish attitudes are bearish for the market because it appears that there are very few resources left to fuel a continued price advance.
When we analyze Rydex assets we assume that this tiny slice of the market more or less represents what is happening in the broader market. This may or may not be the case. For example, Rydex investors could have other cash reserves located somewhere other than in the Rydex system. Nevertheless, Rydex asset analysis appears to be a useful addition to our technical toolbox.


