OVER 800 ARTICLES AND COUNTING! The StockCharts Answer Network (s.c.a.n.) passed another milestone last week with its 800th question getting answered. If you haven't visited it yet, s.c.a.n. is a free user-to-user question-and-answer area where you can get your questions about using StockCharts.com answered quickly by other experienced StockCharts.com users. But don't just visit s.c.a.n. when you have a problem, keeping up with the answers to questions that other people ask can be even more rewarding. Each week another couple of gems pops out of the discussions there - for instance here's one from last week about the differences between Price Channels and Keltner Channels.
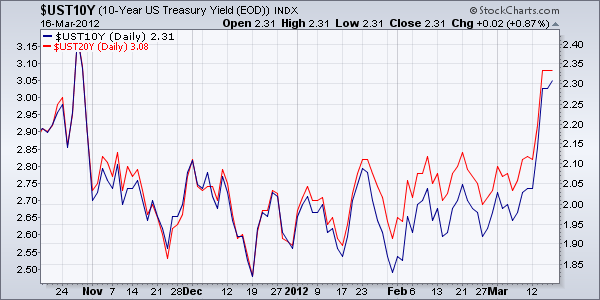
"SAME SCALE" PRICE OVERLAY FIXES BOND YIELD CHARTS - Quick, what is wrong with this picture?
This is a chart with the 10-year and 20-year bond yields overlaid on top of each other. The problem is that the vertical scales are different. Compare the scale of the left with the scale on the right. Now check out this chart:
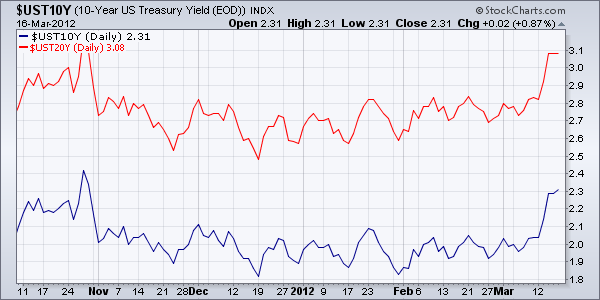
Now that's more like it! Both bond yields are now on the same scale and their distance is accurately displayed. If you want to chart several things on the same scale, you can now do so with the new "Price (same scale)" choice in the SharpCharts "Overlays" dropdown.


