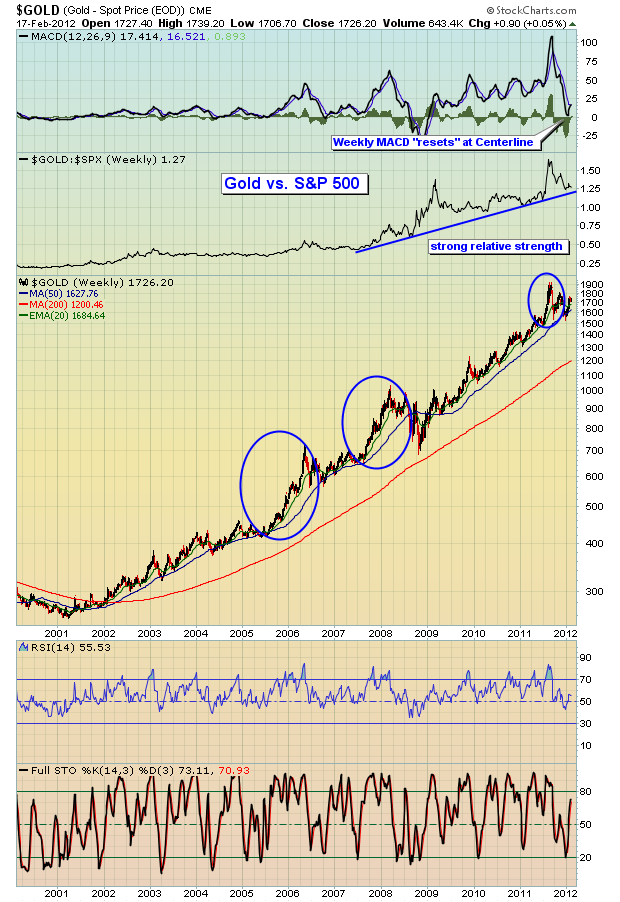
It takes time and patience for continuation patterns to play out. Many traders grow frustrated, especially after the stealth move higher ends because of the time involved for continuation patterns to form. The current bull market in gold has lasted more than a decade and there are few technical signs of it ending now. First, let's take a look at a 12 year weekly chart to step back and grasp the overall picture:

You can see from the blue circles above that every "stealth" move higher has been followed by a longer than usual consolidation period. And that makes sense. There needs to be a cleansing period where a whole new group of longs participate as weaker hands let go of their positions. The other technical observation is that the current consolidation phase has allowed a VERY stretched MACD to move back down to test its centerline. This means that gold's 12 week EMA essentially equaled its 26 week EMA. A lot of the overbought conditions have been relieved. Another observation is that every time gold has seen its weekly RSI dip beneath 50 and its weekly stochastic fall to 20 or below, that combination has resulted in a very strong buy signal.
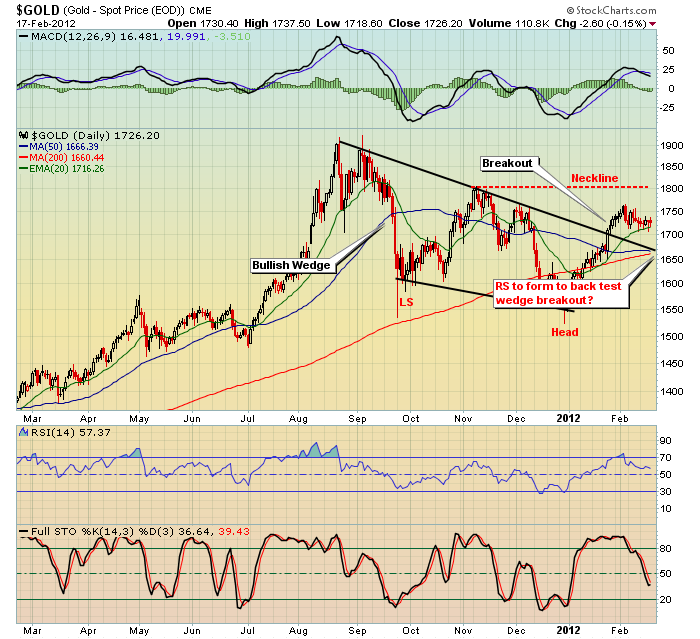
Now let's take a look at the current pattern on a daily chart:

There are a couple of different interpretations which would lead to differing methods of accumulation and risk management. Obviously, we have a bullish wedge breakout, but also have the prospects of an inverse head & shoulders pattern that would measure to 2075 in time. Perhaps an inverse right shoulder will form on a back test of the wedge breakout? Either way, this pattern looks bullish and I'd be a buyer of gold.
I've provided a few technical reasons why I believe gold is going higher. Fundamentally, I believe gold will be higher because Fed Chairman Bernanke wants to inflate our way out of the financial crisis and the resulting economic weakness. The next big issue is going to be inflation, I have no doubt. If you've listened to Bernanke, you know the Fed will do EVERYTHING it can to avoid a deflationary environment. They will continue to expand the Fed's balance sheet. QE 3 is coming so get ready. Ultimately, there will be a price to pay and it's going to come in the form of inflation. What do you think is going to happen to gold prices as inflation is sparked? Inflation may stay historically low for the next couple years, but it is NOT going to remain low. I rest my case.
I'm featuring the GLD as our Chart of the Day for Tuesday, February 21, 2012, where I highlight various entry and exit points to satisfy just about every trader's style. CLICK HERE if you'd like more information.
