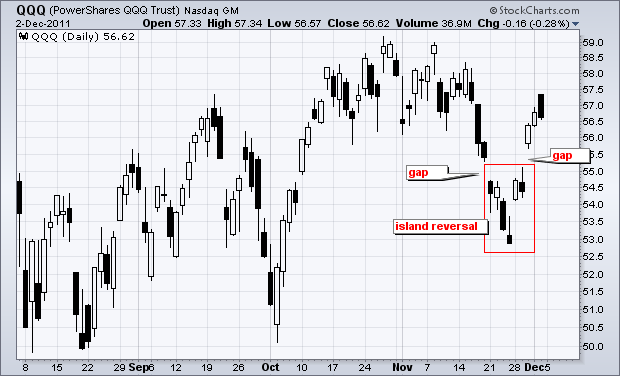
While gaps are not what they used to be, there were a few island reversals on the charts this week. The chart below shows the Nasdaq 100 ETF (QQQ) with a large island reversal over the last three weeks. A bullish island reversal forms with a gap down, a consolidation and then a gap up. The two gaps match, which makes the price data in between appear detached – like an island. Traders establishing short positions between the gaps are trapped on the island with losses.

Click this image for a live chart.
The chart above shows QQQ with a bullish island reversal. The ETF gapped down on November 21st, consolidated and then gapped up on November 30th. Actually, there was even a reversal within the consolidation. QQQ formed an inverted hammer on Friday and then gapped up on Monday. Follow through with Wednesday's big gap completed the island reversal. In general, a gap up is considered bullish as long as it holds. The gap zone turns into the first support zone to watch. A bullish gap should hold. Failure to hold this gap would be bearish.
Good trading!
Arthur Hill CMT
