Hello Fellow ChartWatchers!
First off I wanted to make sure you knew that our Holiday Special is now underway! Long time members will tell you that if you are a StockCharts fan, the best time to join or renew is during our Holiday Sale Special. If you renew right now for 12 months, we'll give you 2 additional months for free. If your account expires within the next 6 months, now is definitely the time to renew. If you have been thinking about becoming a StockCharts member, now is the time to join.
Members: To renew, login and then click the "Your Account" link at the top of the page.
New Subscribers: Click here and select your service level to get started.
Do not let this opportunity pass you by. This sale only lasts through December 19th!
Also, we've inserted a longer article by John Murphy into this newsletter because John has some important, timely observations for everyone right now. Feel free to forward this email to your friends using the link at the top of this email message.
AVERAGE TRUE RANGE COMPARISON
The other day, someone wrote in and asked why our ChartSchool formula for Average True Range (ATR) was different from what they saw on other websites. Curious, we looked into the issue and were very surprised to discover that several other websites were describing ATR incorrectly.
ATR was created by J. Welles Wilder - the creator of the RSI indicator, the ADX indicator, the Parabolic SAR indicator, and several others. He first described it in his amazing book "New Concepts in Technical Trading Systems."
The first part of the equation involved computing something called the "True Range." Everyone gets that part correct. (You can see the details for yourself here.) It's the second part - the "Average" part - that many other websites are getting wrong.
On page 23 of Wilder's book it says:
"The equation for the AVERAGE TRUE RANGE is as follows:
ATR(latest) = ( 6 x ATR(previous) + Today's True Range ) / 7
To get the ATR initially, add the true range, as defined, for the past seven days and divide by seven. The answer from this will be used as the ATR(p) in the equation for the next day."
On page 26, Wilder reiterates the steps:
"2. ATR -- AVERAGE TRUE RANGE
A. Initially obtained by adding the true ranges for seven days and dividing by seven.
B. The latest ATR is obtained by multiplying the previous ATR by six, adding today's true range and then dividing the total by seven."
Those discussions are in the context of creating a 7-day ATR. To create the more typical 14-day ATR, you would use 13 instead of 6 and 14 instead of 7 in the above formula. That's the same as the information we present in our ChartSchool article and it's what we use in our programs.
Unfortunately, other website just take the 14-period Simple Moving Average of the True Range values and call that average the ATR. That is a huge mistake on their part caused - we guess - by laziness.
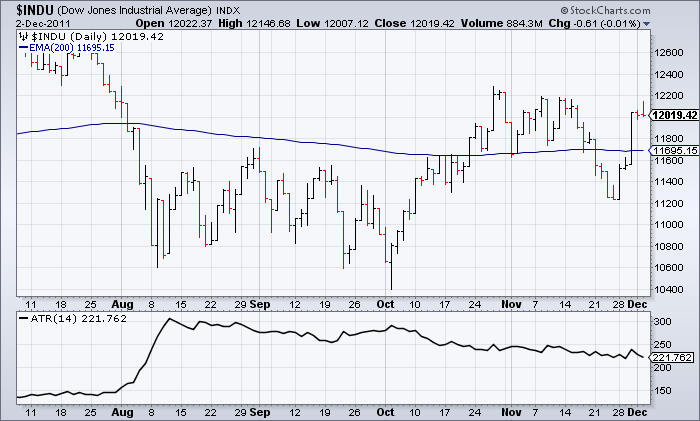
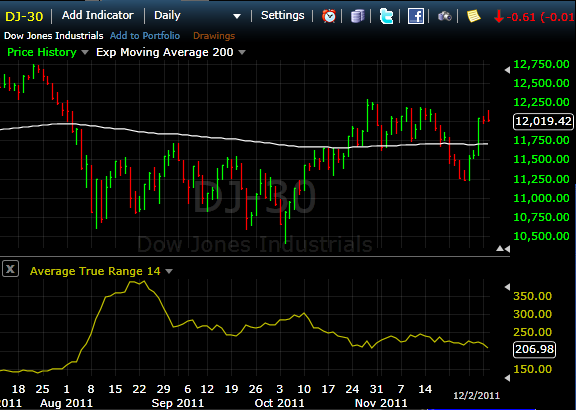
To see why, lets look at the current ATR value of the Dow Jones Industrial Average using our website and a popular competitor's site:
So we show that the Dow's ATR(14) should be 221.762 whereas our competition shows it at 206.98. That's a HUGE difference! Why is that?
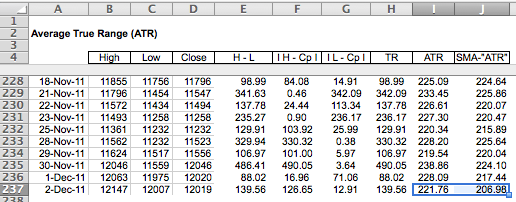
The answer is obvious if you look at the following Excel spreadsheet that calculates ATR using both Welles Wilder's way of averaging things and the simple moving average method. Here's a screenshot of the bottom of that speadsheet:
And there you go - If you use the Wilder averaging method you get 221.76 which is what our chart shows. If you don't do your homework and assume that "Average" means "Simple Moving Average", you get 206.98 just like our competitor does.
(BTW, our chart shows the 200-day EMA at 11695.15 whereas the competition has it at 11703.14. Here a link to an article explaining why our number is correct in that case as well.)
The bottom line here is that StockCharts.com is 100% dedicated to accurate calculations and we take the time to go to the authoritative source for our formulas. Not everyone does that and, if they can't get ATR correct, what else do they have wrong?
Happy Holidays!
- Chip


