I always find myself turning my attention to "next year" in the stock market as we enter the December holiday season. On many fronts, 2011 has been the most challenging year in equities that I've ever seen. Sure, the losses in 2008 and the fear that accompanied those losses were worse, but there were many signs in 2007 and 2008 that told us a weak market was dead ahead. 2011 has been particularly difficult because many technical signs have changed mid-stream. For a week or two, it appears we have one type of market only to find the next week it's completely different. November 2011 was the perfect example. There was a clear breakdown on our major indices as we fell beneath critical price support and moving averages. The MACD fell beneath its centerline and the momentum was clearly bearish. Then central bankers around the globe aided the bulls and the recovery was just as astonishing as the selloff. Take a look:

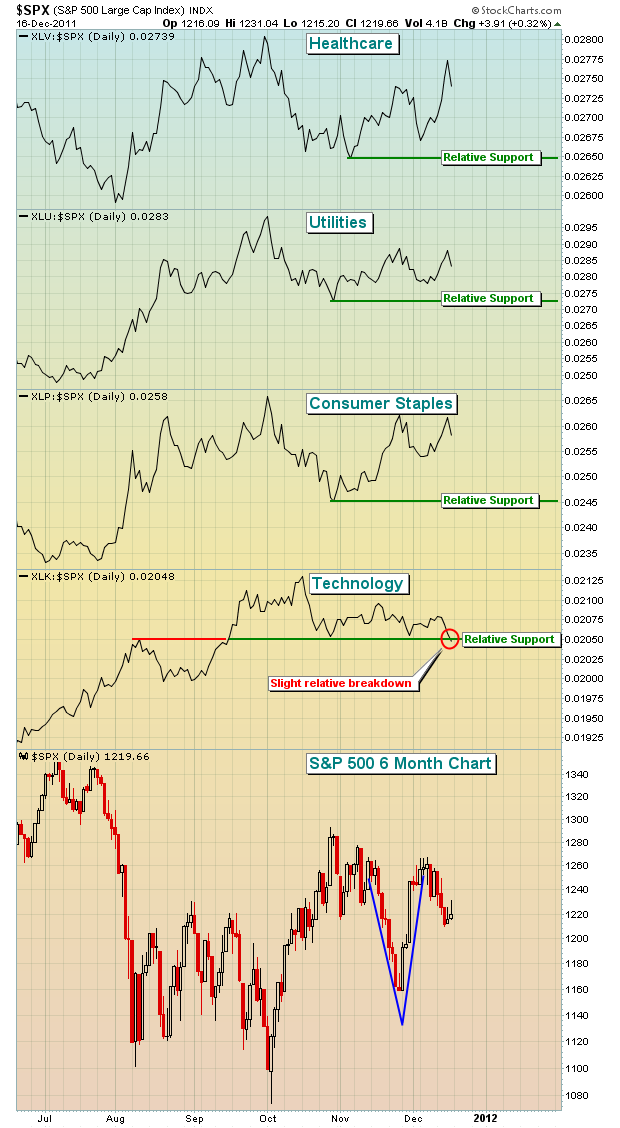
The second half of November was simply crazy - huge breakdown followed by huge recovery.
Also included on the chart above is a comparison of the three defensive sectors - healthcare, utilities and consumer staples - and one of the aggressive sectors (technology), all of which have recently held up quite well on a relative basis. The problem? On Friday, technology broke down beneath a relative support level that previously held in both October and November. This doesn't necessarily mean the market will move lower, but it certainly doesn't help. By contrast, look at the relative strength lines of our defensive sectors. Every one continues to print higher highs and higher lows, suggesting that the flight to safety and the "risk off" environment is alive and well. I'd like to see this "below the surface" message change, but so far it's been a no-go.
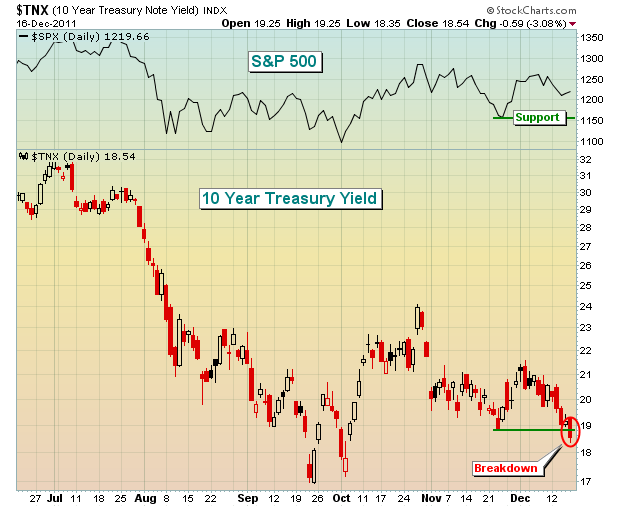
Need more proof of the "risk off" environment? Let's pull up a one year chart of the 10 year treasury yield:

The yield moves opposite of treasury prices. Therefore, a breakdown in the yield means money is flowing INTO treasuries, a safe haven for investors. On Friday, the yield closed at its lowest level since early October as money poured into treasuries. The scary part is that treasury yields have led the S&P 500 by the nose for the last several years. It's difficult to be overly bullish equities at a time when money continues to find its way into treasuries.
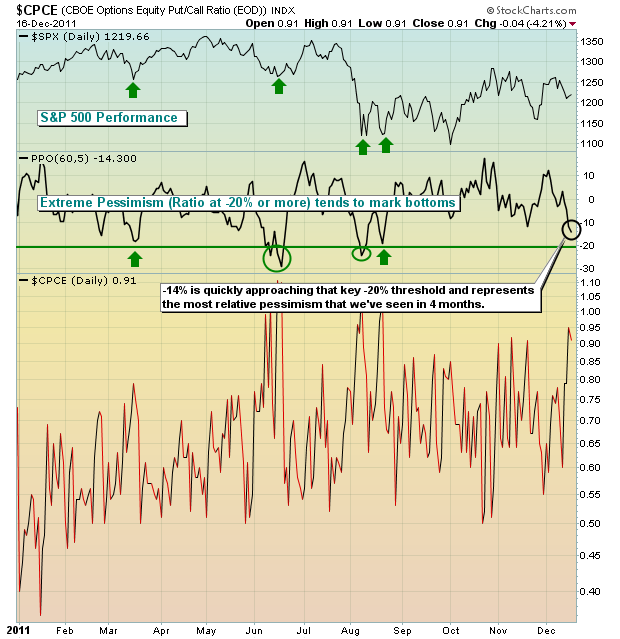
Despite all the negative signs emerging, sentiment is quickly turning into a short-term positive. The VIX closed at its lowest level since early August on Friday. From an historical perspective, it remains elevated, but it is within the confines of a general downtrend since August. A VIX that trends lower is normally a friend of the bulls. A more powerful short-term bullish signal could be emerging in the form of my relative pessimism ratio. With the information gleaned from the CBOE and the powerful charting tools here at StockCharts, I developed the following chart that has a very solid track record in predicting SHORT-TERM reversals. I am emphasizing "short-term" because this indicator tells us when sentiment has moved too far in one direction. Once it unwinds, the market is free to move in either direction. So please keep in mind two things - (1) past results NEVER guarantee future success and (2) this is a short-term indicator by nature. With that in mind, check out the following chart:

It will take more bearishness in options land on Monday to push this relative pessimism level to a -20% level, which is the level where we've previously seen market reversals. But everyone should be aware that we're getting close as the ratio of puts to calls on a relative basis are higher than at any time since early August.
On Tuesday, December 20th, I will be leading my 2012 Market Outlook webinar, discussing areas of potential strength and weakness in the months ahead. It will be educational, in addition to informative, and I'd love for you to join me. CLICK HERE for more details.
HAPPY HOLIDAYS and happy trading!
