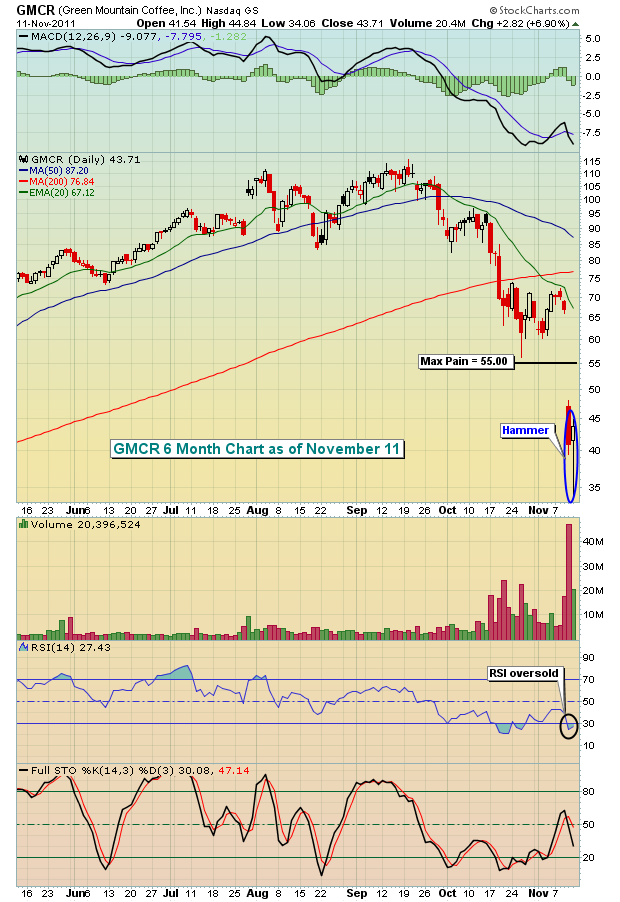
For an options expiration week, volume was quite light. Any time volume is light, the threat of market manipulation grows. As we headed into last week, max pain suggested a potential 2.5%-3.5% move lower in equity prices, depending on the index. With hindsight now, we see the major indices fell in the 3.0%-4.0% range last week. Coincidence? I have my own personal feelings, so you be the judge. One stock that was DEEP in terms of in-the-money puts was Green Mountain Coffee (GMCR). Take a look at this chart BEFORE last week's options manipulation:

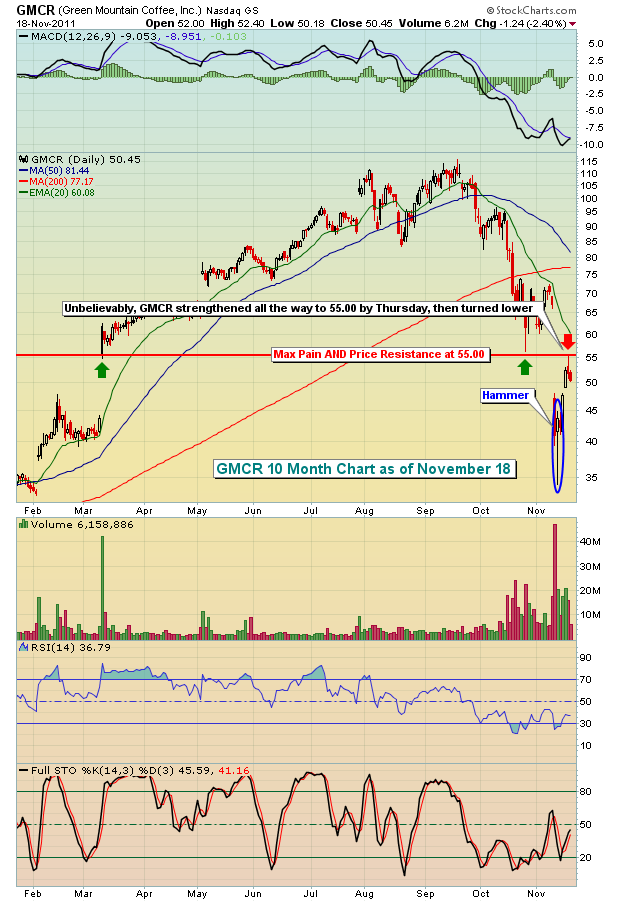
It was clearly in the market makers' best interest to steer prices higher, but who would have thought that max pain at 55.00 would be a possible destination? Well, here's how the week unfolded for GMCR longs:

This was a perfect example of what happens during options expiration week. Obviously, they don't all work out like GMCR, but remaining on the short side heading into options expiration week was a HUGE risk. In addition to all the in-the-money puts, GMCR was oversold and had printed a reversing hammer candlestick on massive volume - not exactly the recipe for more gains on the short side. Notice also that 55.00 wasn't just the max pain number. It also was significant price resistance. Failure at that level was to be expected based on overhead supply.
The study of price support and resistance is the topic in this month's Online Traders Series event, scheduled for Tuesday, November 22, 2011 at 4:30pm EST. If you'd like to attend, please check out our holiday special offer to all ChartWatchers' readers HERE.
GMCR was a specific stock example of options manipulation, but I see this type of manipulation on the overall indices frequently, which is why I check out max pain heading into the third week of every calendar month (options expire the third Friday of each month).
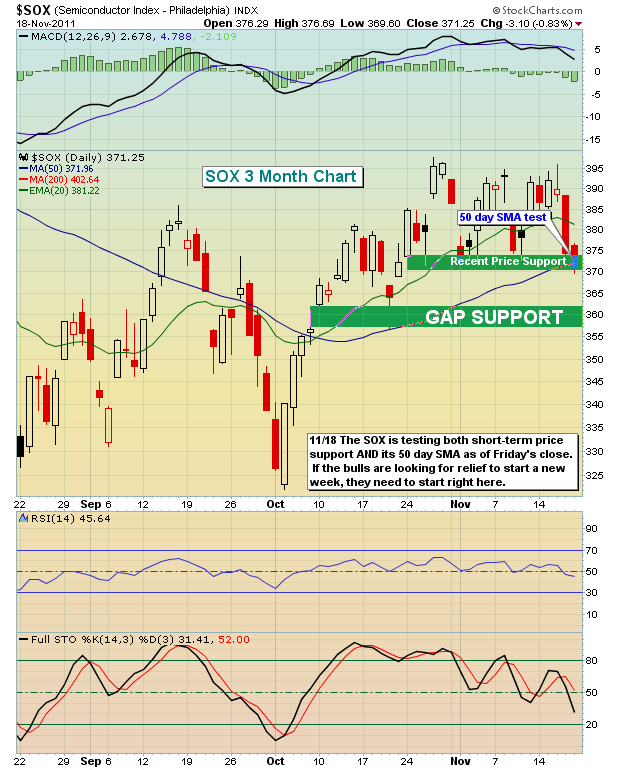
Given the extent of last week's selling, there are a couple of charts that I'd pay particular attention to. Semiconductors, which looked great just a few days earlier, really struggled late in the week and are on the verge of a major breakdown. Take a look:

Finally, Europe continues to be the dog and the U.S. is the tail. If the major indices in Europe begin to lose major price support, it's very unlikely support will hold on the S&P 500. Here are the levels you need to be aware of on the German DAX and S&P 500 as a new trading week unfolds:

Happy Thanksgiving and happy trading!
