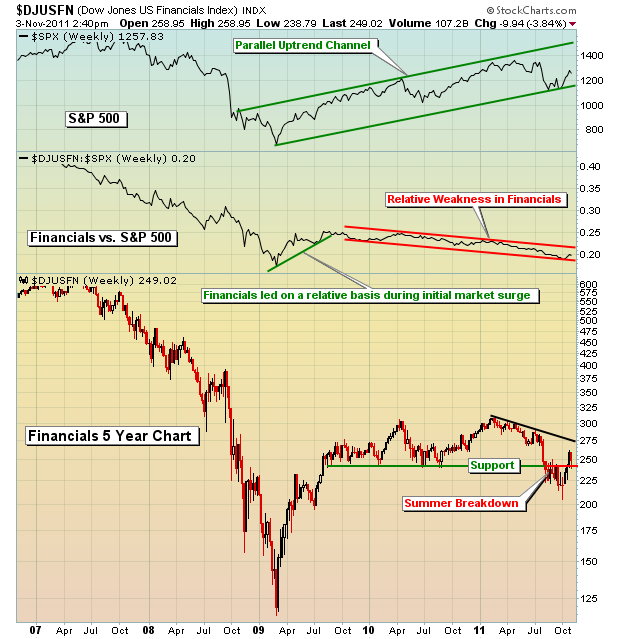
When you review the history of the stock market, you see that financials tend to hold the key for whether a stock market advance is sustainable or not. The long-term chart below still raises questions about the sustainability of not only the October rally, but also the multi-year rally off of 2009 lows. Why? Well, mainly because the relative strength line of financials has been in a downtrend since August 2009. Check out the chart below:

From the March 2009 lows until the end of August 2009, the S&P 500 rose from a low of 666 to a high of 1021. Roughly 60% of the rally off the 2009 lows occurred during that brief stint while financials were in a leadership role. During that rally and in less than six months, the S&P 500 rallied 53% while the Dow Jones US Financial Index gained 125%. The huge rally in financials carried the entire stock market on its shoulders. Since that time, the S&P 500 has continued to push higher, but it's been a struggle with a cumulative gain of little more than 20% over the past 26 months. During that 26 month stretch, the DJUSFN is basically flat. So, in my view, it comes down to one thing:
Where are the financials heading in the short-term?
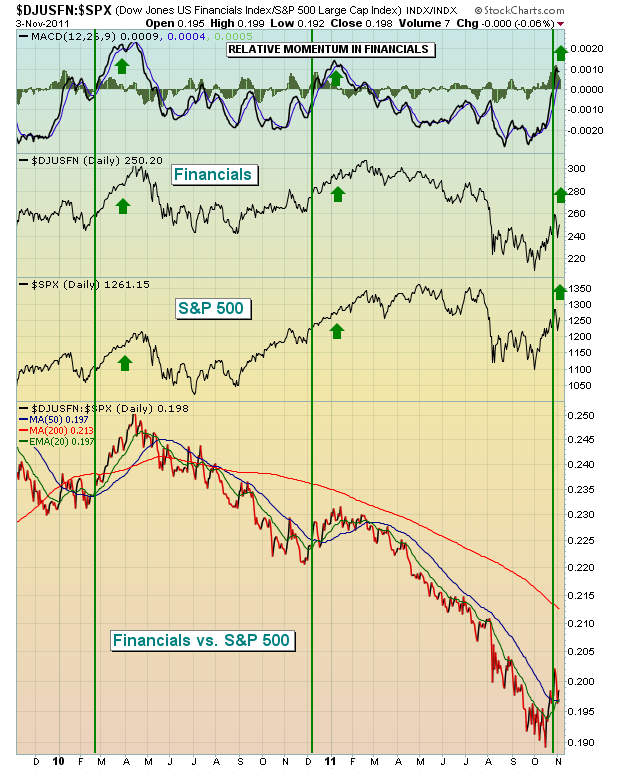
While the longer-term chart of the DJUSFN above looks ominous, the short-term chart of financials has improved drastically. In fact, during the last three weeks of October, financials were the top performing sector. The MACD of the relative ratio between financials and the S&P 500 has just crossed the centerline showing that the relative strength of financials is gaining momentum. The last two such signals have preceded very bullish moves in both financials and the S&P 500.
Check this out:

In my Friday blog, I highlighted a financial that could be poised to benefit from future bullishness in the financial sector. Feel free to check it out by clicking here.
